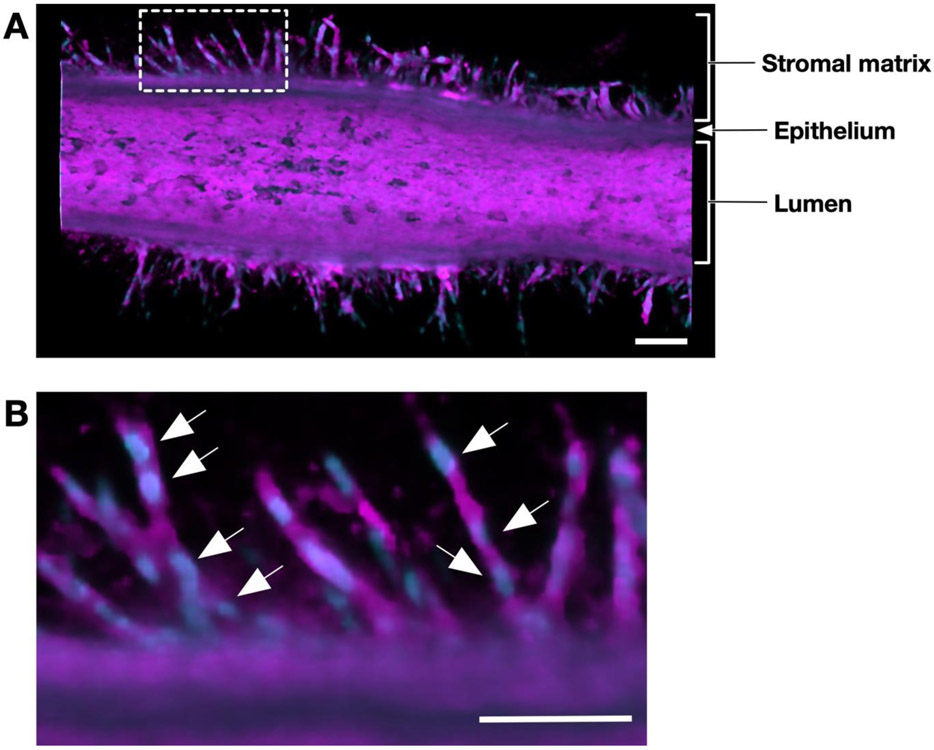
Figure 5.
Confocal micrographs of collective migration of cancer cells. (A) Confocal micrograph of an mKIC duct after 3 days culture stained for cell membranes (magenta) and nuclei (blue). (B) Confocal micrograph of the enlarged white boxed area. Arrows indicate individual cells which make up invading cell chains. Scale bars represent 100 μm.

