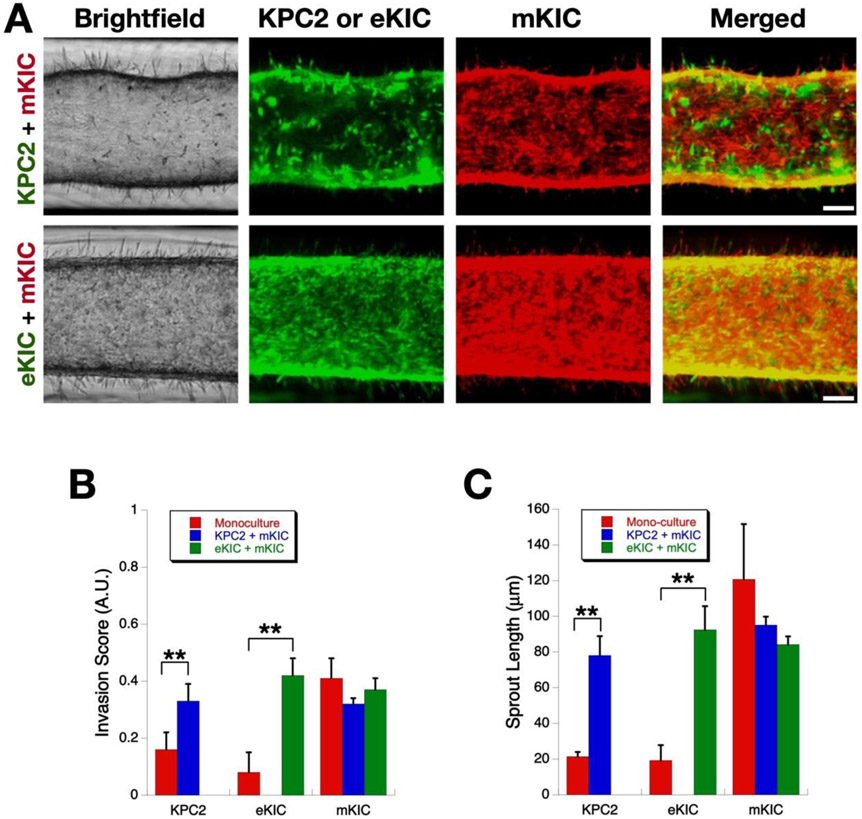
Figure 7.
Enhancement of cancer cell invasion by interactions between heterogenous cancer cells. (A) Micrographs of invasion of co-culture models. Scale bars represent 100 μm (B) Invasion score at Days 3 and 4. Both KPC2 and eKIC become more invasive after co-culture (**, p < 0.01). However, the invasiveness of mKIC line remain the same regardless of mono- or co-cultures. (C) Mean sprout length (**, p < 0.01).

