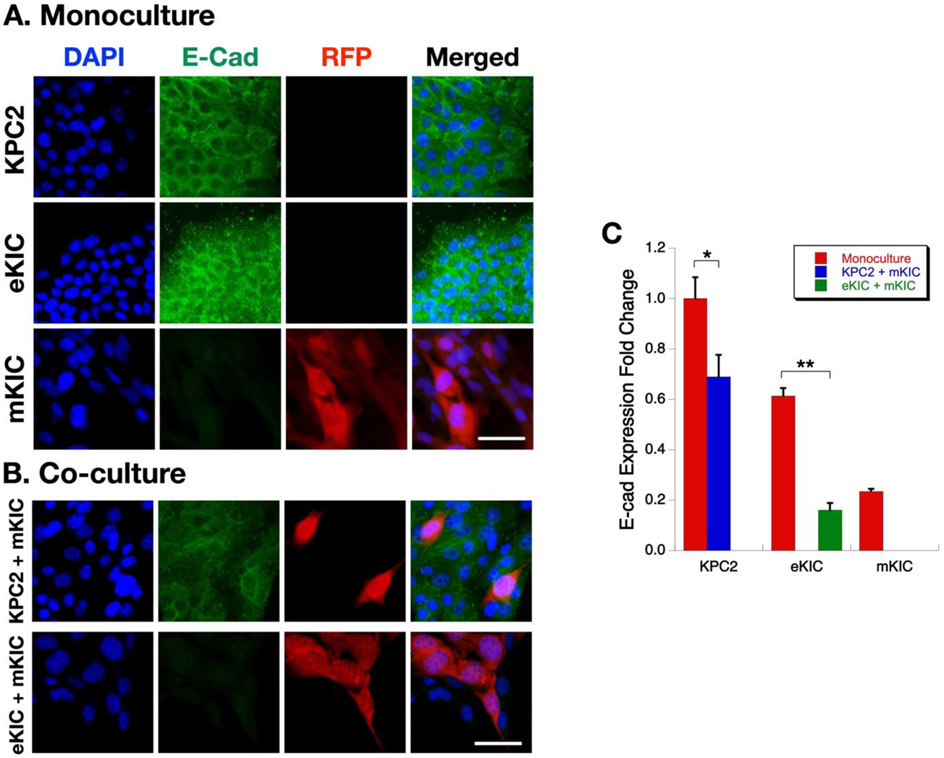
Figure 8.
Immunostaining of E-cadherin in mono- and co-culture. (A) Immunofluroescence analysis of KPC2, eKIC, mKIC monocultures. (B) Immunofluorescence analysis of KPC2 + mKIC, and eKIC + mKIC co-cultures. DAPI (i.e., nuclei), E-cad, RFP (i.e., mKIC), and merged images are shown. Scale bar represents 50 μm. (C) Fold change of E-cadherin expression. (*, p < 0.05 and **, p < 0.01)

