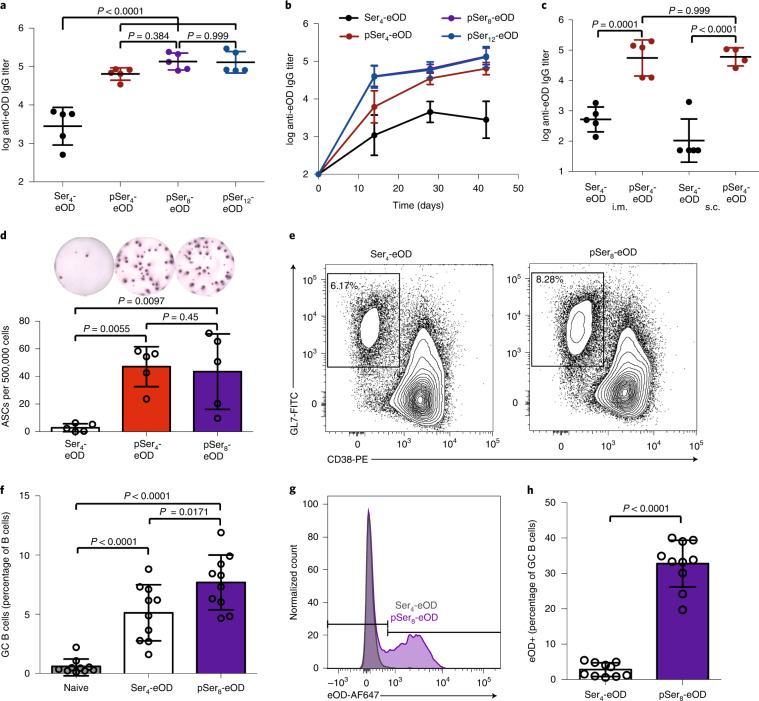
Fig. 2. Alum-binding pSer antigens elicit enhanced humoral responses in vivo.
a,b, BALB/c mice (n = 5 per group) were immunized with 50 µg of alum mixed with 5 µg of eOD (with pSer or control Ser tag modification); serum IgG titers were analyzed by ELISA at 6 weeks (a). IgG titers were analyzed over time by ELISA (b). Data are represented as mean ± s.d. of log-transformed data. c, BALB/c mice (n = 5 per group) were immunized with 50 µg of alum and 5 µg of eOD by s.c. or i.m. routes; shown are serum IgG titers at 6 weeks. Center lines represent mean and s.d., respectively of log-transformed data. d, Three months after immunization as in a, eOD-specific antibody-secreting cells (ASCs) from bone marrow were assayed by ELISPOT. Center lines and error bars represent mean and s.d., respectively. e–h, BALB/c mice (n = 10 mice pooled from two independent experiments) were immunized with 5 µg of eOD and 50 µg of alum by s.c. route, and germinal center responses were assayed on day 9 by flow cytometry of dLNs. Shown are representative flow cytometry plots (e) and mean GC B cell frequencies (f), representative histograms (g) and frequencies of GC B cells binding AF647-labeled eOD (h). Data in f and h are represented as mean ± s.d. Statistical comparisons in a,c,d,f were performed using one-way ANOVA followed by Tukey’s post hoc test. Comparisons in a and c were performed using log-transformed data. Statistical comparison in h was performed using unpaired, two-tailed Student’s t-tests.

