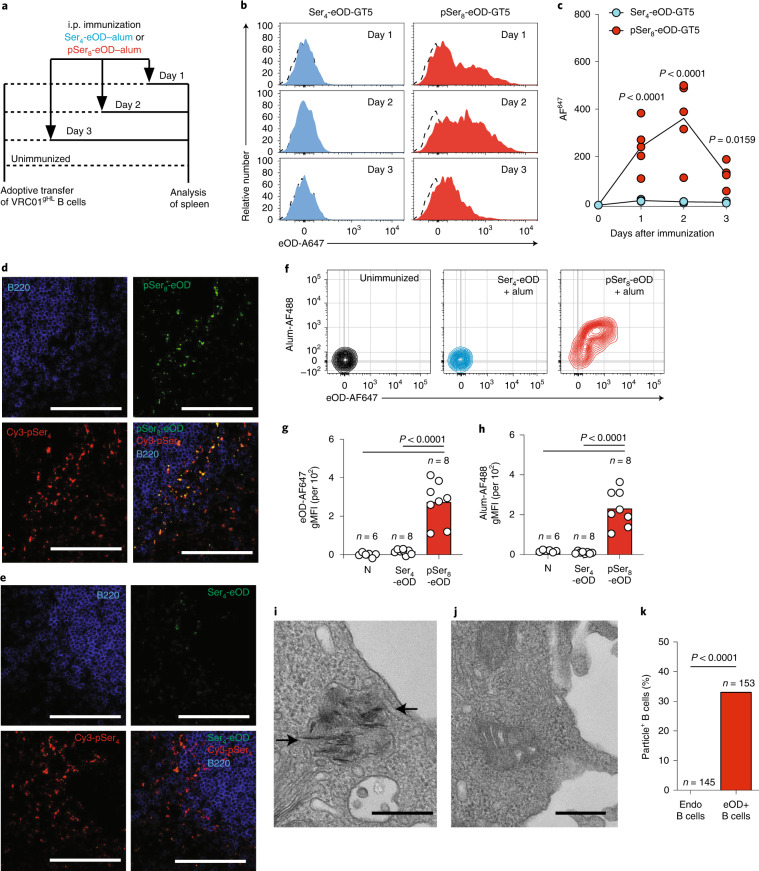
Fig. 3. Antigen-specific B cells efficiently take up pSer-antigen bound to alum particles in vivo.
a–c, C57BL/6 mice adoptively transferred with 1 × 10⁶ GFP+CTV+VRC01gHL B cells were immunized by intraperitoneal (i.p.) injection of 5 µg of AF647-labeled Ser4-eOD-GT5 or pSer8-eOD-GT5 together with 1 mg of alum. Timeline of adoptive transfer experiment (a). Flow cytometry analysis of splenic VRC01gHL B cell binding to AF647-labeled eOD-GT5 in vivo (b). Dotted lines indicate background signal in unimmunized controls. Quantification of AF647-labeled eOD-GT5 fluorescence of splenic VRC01gHL B cells (c). Lines indicate the mean. Data are combined from two independent experiments (n = 4 mice for days 1 and 3 Ser4-eOD-GT5, n = 5 mice for day 2 Ser4-eOD-GT5 and days 1–3 pSer8-eOD-GT5). Statistical analysis was performed by a two-tailed Student’s t-test. d,e, Histological images of spleens from mice 2 d after immunization by i.p. injection with 10 µg of AF647-labeled pSer8-eOD-GT5 (d) or Ser4-eOD-GT5 (e) and 100 µg of Cy3-pSer4-labeled alum (left scale bar, 1 mm; middle and right scale bars, 100 µm; n = 3 per group). f–h, C57BL/6 mice adoptively transferred with 1 × 10⁶ CTV+VRC01gHL B cells were immunized with 5 µg of AF647-labeled Ser4-eOD-GT5 or pSer8-eOD-GT5 and 1 mg AF488-pSer4-labeled alum (alum-AF488) and splenic VRC01gHL B cells were analyzed 48 h after immunization. Representative flow cytometry analysis of splenic VRC01gHL B cells (f). Bars represent the mean. Quantification of antigen acquisition by VRC01gHL B cells (g). Bars represent the mean. Quantification of alum acquisition by VRC01gHL B cells (h). Data are combined from two independent experiments. Statistical comparison was performed using one-way ANOVA with Tukey’s post hoc test. i,j, On day 2 following i.p. immunization with 10 µg of AF647-labeled pSer8-eOD-GT5 with 1 mg of alum, GFP+AF647+VRC01gHL B cells (i) or GFP–AF647– endogenous B cells (j) were sorted from the spleen, fixed, stained and sectioned for TEM imaging (scale bars, 200 nm). Shown are representative images from 145 (i) and 153 (j) cells analyzed. Arrows indicate internalized alum particles. k, Quantification of observed percentage of cell sections positive for alum particles in endogenous (endo) and eOD-GT5+ B cells. Statistical analysis was performed using a two-proportions z-test.

