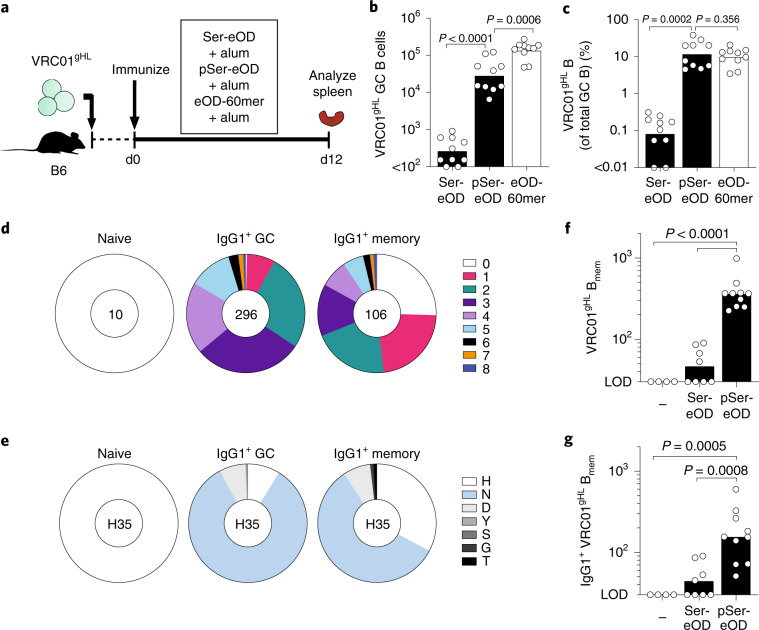
Fig. 5. pSer-antigen:alum nanoparticles recruit rare B cells to GCs and induce somatic hypermutation and memory.
a, Schematic representation of the experimental design for the germinal center experiments in b,c. Data are combined from two independent experiments. Bars indicate the geometric mean (n = 10 mice per group). Statistical analysis was performed by one-way ANOVA followed by Tukey’s post hoc test on a log-transformed dataset. b, VRC01gHL GC B cells per spleen (see Extended Data Fig. 8a for gating). c, Percentage of VRC01gHL B cells of total GC B cells in the spleen. d–g, CD45.1+ B6 mice adoptively transferred with 1 × 10³ VRC01gHL were left unprimed or immunized with either Ser4-eOD-GT5gp61:alum or pSer8-eOD-GT5gp61:alum and the spleens were analyzed for VRC01gHL memory B cells on d30 or d35. Data are combined from two independent experiments. d,e, Heavy chain mutation analysis of single-cell sorted naive VRC01gHL cells, VRC01 GC B cells from d18 pSer-eOD-GT5gp61:alum immunized mice (n = 296 cells, four mice), and VRC01gHL memory B cells from d35 pSer-eOD-GT5gp61:alum immunized mice (n = 106 cells, four mice). d, Circle charts represent the fraction of gVRC01 heavy chain sequences that acquired the indicated number of amino acid mutations. Total number of individual B cell sequences is shown at the center of the circle. e, Circle charts of heavy chain amino acid substitutions at H35 (Kabat numbering). f, GC-derived VRC01gHL memory B cells (Bmem) per spleen. Limit of detection (LOD), 30. Bars indicate the geometric mean (see Extended Data Fig. 8b for gating). g, IgG1+ GC-derived VRC01gHL memory B cells per spleen. LOD, 30. Bars indicate the geometric mean (n = 4 mice for unprimed; n = 8 mice for Ser4-eOD-GT5gp61:alum; n = 10 mice for pSer8-eOD-GT5gp61:alum). Statistical analysis was performed by one-way ANOVA followed by Tukey’s post hoc test on a log-transformed dataset.

