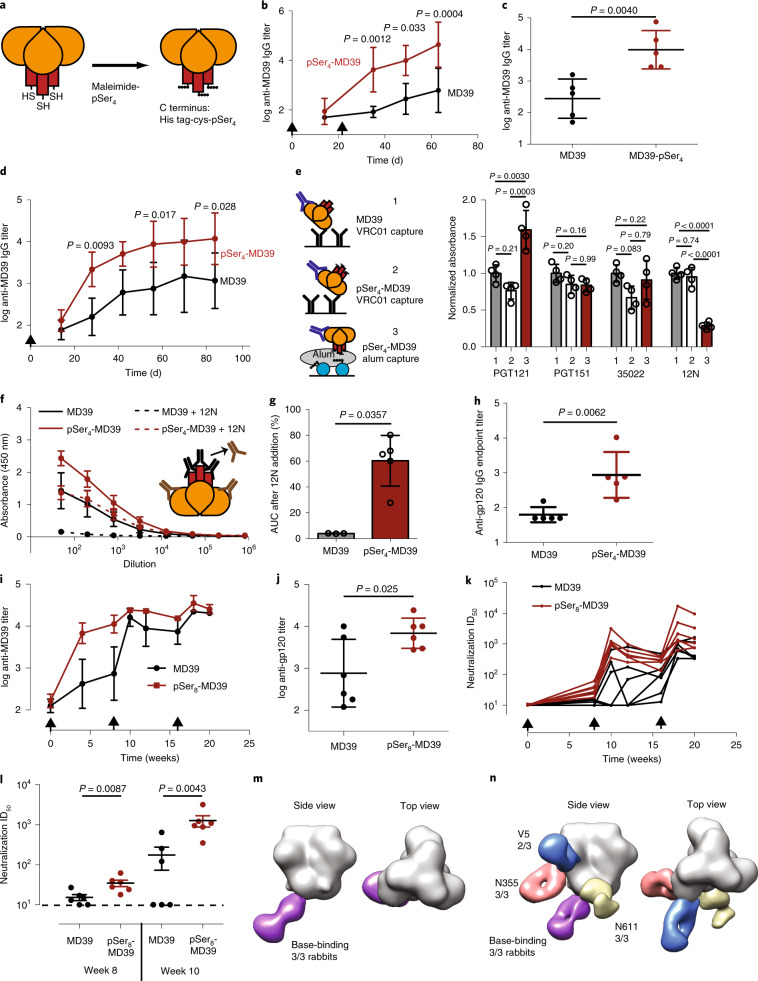
Fig. 6. Enhanced humoral responses to HIV Env trimer immunogens elicited by pSer-antigen:alum immunization.
a, Schematic of pSer conjugation to the base of MD39 trimer immunogens. b,c, BALB/c mice (n = 5 per group) were immunized with 2 µg of MD39 (with or without pSer modification) mixed with 50 µg of alum at days 0 and 21. b, Serum IgG titers are shown over time. Statistical comparison by two-way ANOVA followed by a Bonferroni test of the log-transformed data. Data are represented as mean ± s.d. of the log-transformed data. c, IgG titers from individual mice on day 63. Center value and error bars represent mean and s.d., respectively of the log-transformed data. d, BALB/c mice (n = 5 per group) were immunized with 5 µg of MD39 or pSer4-MD39 mixed with 50 µg of alum and 5 µg of saponin adjuvant. Serum IgG titers are shown over time. Statistical comparison by two-way ANOVA followed by a Bonferroni test. Data are represented as mean ± s.d. of the log-transformed data. e, Antigenicity analysis of MD39 trimer captured on VRC01-coated ELISA plates (1); pSer4-MD39 captured on VRC01-coated ELISA plates (2); or pSer4-MD39 captured on alum-coated ELISA plates (3). Binding replicates (n = 3) are shown from one representative experiment, which was performed in duplicate. Shown are raw ELISA absorbances for binding of indicated monoclonal antibodies added at 0.1 µg ml−1. Center value and error bars represent mean and s.d., respectively. Statistical analysis was performed using one-way ANOVA followed by a Tukey’s post hoc test. f–h, BALB/c mice (n = 5 mice) were immunized with 2 µg of MD39 or pSer4-MD39 mixed with 50 µg of alum on days 0 and 21. Raw ELISA dilution curves for day 63 MD39-specific IgG assessed in the presence or absence of 20 µg ml−1 competing base-binding monoclonal Ab 12N. Data are represented as mean ± s.e.m. (f). Area under the curve of ELISA signal in the presence of 12N Ab (normalized to area under the curve in the absence of base-blocking Ab) (g). Center lines and error bars represent mean and s.d., respectively. Two data points were removed from analysis in the MD39 group because of low titers. MD39 gp120-specific IgG titers are shown at day 63. Center value and error bars represent mean and s.d., respectively of the log-transformed data (h). i–l, New Zealand white rabbits (n = 6 per group) were immunized on days 0, 56 and 112 by bilateral s.c. injection with 1 mg of alum and 100 µg of MD39 or 100 µg of pSer8-MD39 per animal. Overall MD39-binding IgG titer assessed by ELISA as a function of time (i). Data are represented as mean ± s.d. Center value and error bars represent mean and s.d., respectively of the log-transformed data. gp120-specific titer measured by ELISA at week 10 (j). Center value and error bars represent mean and s.d., respectively of the log-transformed data. Neutralization titers, assessed as the serum dilution required to neutralize 50% of the autologous tier 2 virus, measured as a function of time (k). ID50, infective dose. Center lines are represented as mean and s.d., respectively. Neutralization titers at week 8 (after prime) and week 10 (2 weeks after boost) (l). Center value and error bars represent mean and s.d., respectively. m,n, Single-particle EM analysis of polyclonal IgG antibodies isolated from rabbit sera collected at day 70 from rabbits immunized with MD39 (m) or pSer8-MD39 (n). Binding was measured for three rabbits for each immunization condition and representative images are shown. Statistical tests used were unpaired, two-tailed Student’s t-test of the log-transformed data (c,h,j) and a two-tailed Mann–Whitney U-test (g,l).

