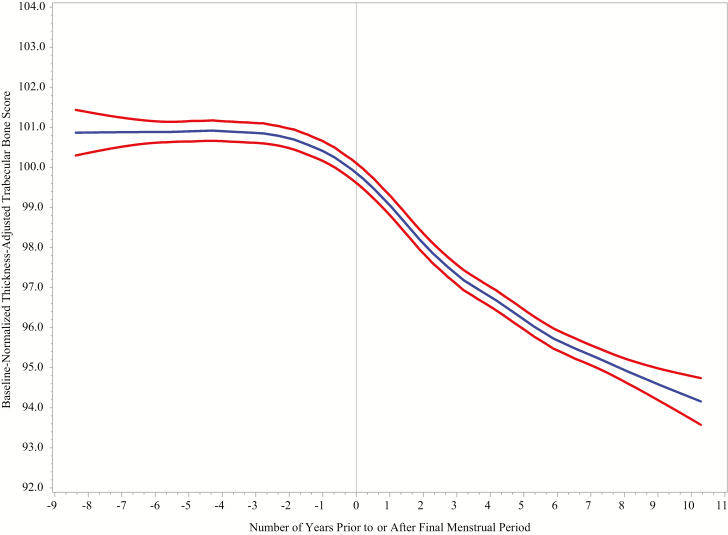
Figure 3.
LOESS plots of baseline normalized values of TBS_TH in relation to time before or after the FMP in the analysis sample. Participants are from the Study of Women’s Health Across the Nation Trabecular Bone Score Study. Blue curves illustrate mean values. Cross-sectional, 95% confidence intervals are indicated by the red curves. Number of observations is 6831. To minimize outlier influence, the plot is truncated at the extremes of FMP-time, 8 years before FMP (5th percentile) and 10 years after FMP (95th percentile). The LOESS plot presents a cross-section at each time; thus, it is influenced by the sample composition at each cross-section and by between-women differences. Therefore, the LOESS plot is used only to develop a hypothesis about the functional form of the relation between the exposure (FMP time) and the outcome (TBS_TH). Abbreviations: LOESS, locally estimated scatterplot smoothing; FMP, final menstrual period; TBS_TH, thickness-corrected trabecular bone score.

