
Figure 3.
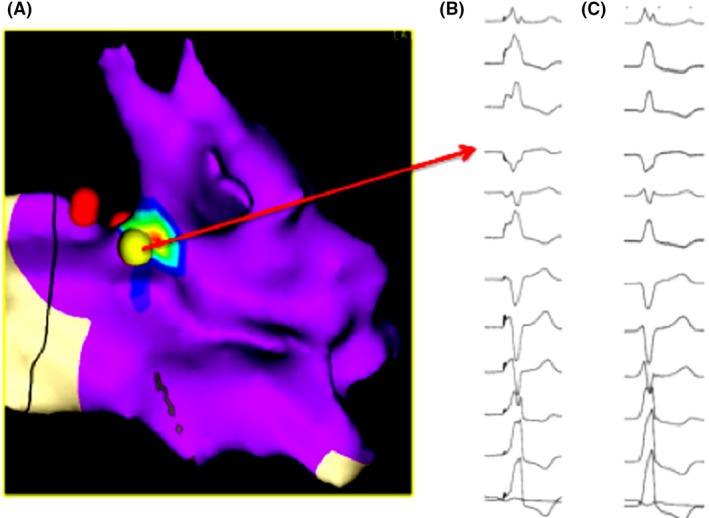
Left panel (A) shows activation map indicating pacemap from successful ablation region (yellow dot); His region on the red dots. Right panel shows perfect match between ventricular pacing from ablation region (B) and clinical ectopic beat (C)