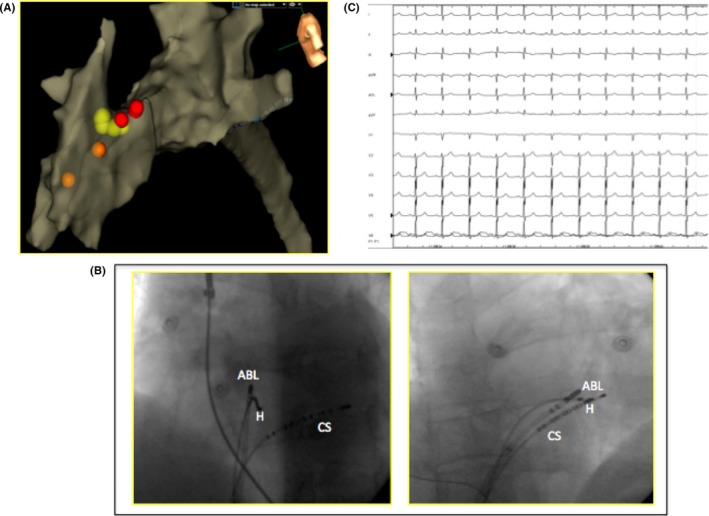
Figure 4.

A, Anatomic map of right ventricle with depiction of tricuspidal valve and right atrium. (left latero‐lateral view). Red tags show His location. Orange tags show right bundle branch potentials while yellow dots represent where cryoenergy has been delivered. B, Angiographic LAO and RAO views. C, the electrocardiographic final result after successful cryoablation
