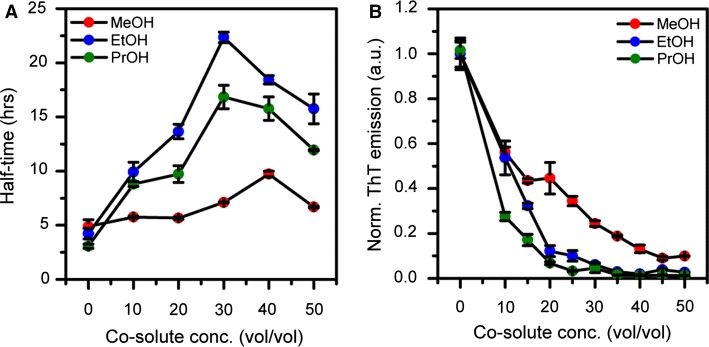
Fig. 6.
a Reaction half-times extracted from the data in Fig. 4 for the kinetics of insulin amyloid formation in ammonium acetate buffer containing increasing volume fractions of respectively methanol (red, MeOH), ethanol (blue, EtOH), and isopropanol (green, PrOH). b Change in end-point ThT fluorescence for the kinetic traces shown in Fig. 4 reported as function of alcohol concentration for methanol (red), ethanol (blue), and isopropanol (green). The error bars represent standard deviation (n = 3)

