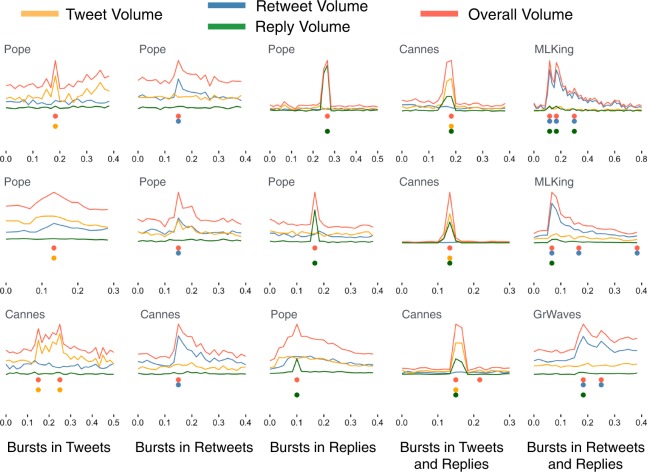
Figure 2.
Demultiplexing collective attention into specific activities. Different social actions contribute to online collective attention. Here we disentangle three different actions – lines and dots in different colors in each panel – and show their intensity (y–axis) over time (x–axis), as well as their combination (Overall Volume). Each of the 15 panels shows a spike reflecting a burst of activity (the time of the spike is indicated by a red dot). Spikes were automatically detected in the time series of overall volume (see Materials and Methods section for details on the detection method). Each column of three panels shows spikes due to different social actions, as indicated by the label in the lower corner (the first column shows three spikes originated from tweets, the second column shows three spikes originated from retweets, etc.). Multiple spikes occur during different exceptional events, the event of each spike is indicated in the label in the top-left corner of each panel.

