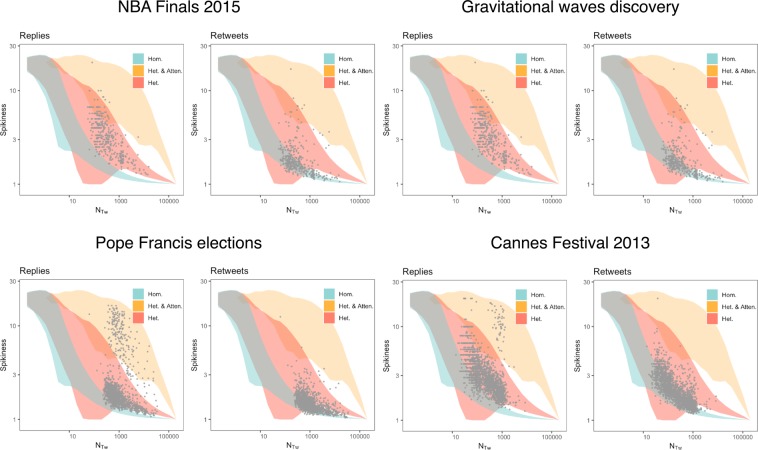
Figure 3.
Fluctuation analysis of social bursts during collective attention. Spikiness S – Eq. (3)– is plotted against number of tweets – NT,w – for two social activities (replies and retweets) during four exceptional events. Each dot is the result (empirical data) obtained in a time window w of size ℓ = 20 minutes (i.e., NT,w = 1000 indicates an average of 50 posts per minute). Shaded areas indicate the 90% confidence around the expected S obtained simulating our model in the three scenarios: (i) homogenous social structure with uniformly distributed attention (“Hom.”); (ii) social structure obtained from preferential attachment with uniformly distributed attention (“Het.”); (iii) social structure obtained from preferential attachment with preferential attention (“Het. & Atten.”).

