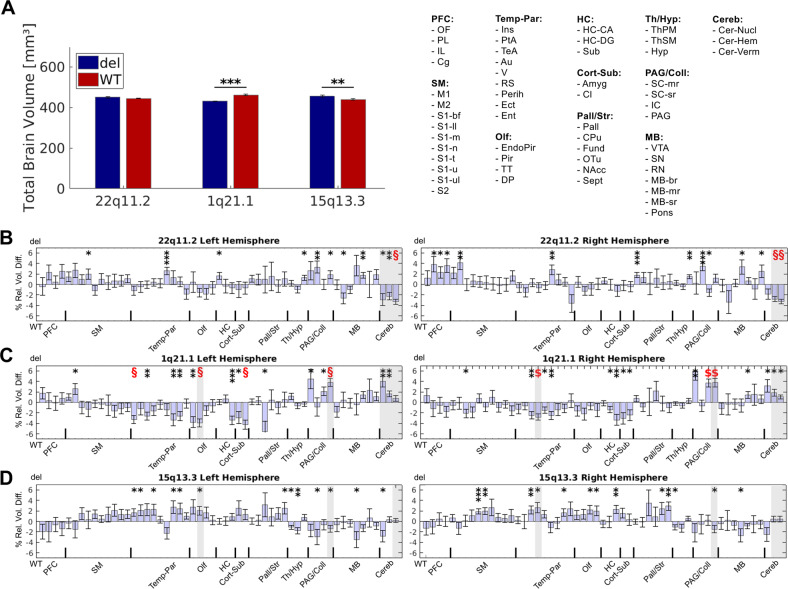
Fig. 2. Total and regional brain volume differences between Df(h22q11)/+, Df(h1q21)/+, and Df(h15q13)/+ mice and their respective controls.
Bars (mean) with error bars (standard error of the mean) illustrate total a and regional b–d alterations in the brain volume. a Deformation-based morphometry revealed a significantly smaller total brain volume in Df(h1q21)/+ mice compared with their controls, whereas Df(h15q13)/+ mice exhibited a significantly larger total brain volume. Regional volume changes between the three CNVs and their littermate controls illustrated in b–d demonstrate the percentage difference of the relative regional brain volumes (% of respective total brain volume) of the CNV compared with its WT control allowing to interpret the results as focal alterations independent from the whole-brain changes caused by the CNVs. Shadowed areas in b–d illustrate between-CNV differences (in relation to the respective WT) revealed by the ANOVA interaction effects (p < 0.05, Bonferroni-corrected for 104 brain regions and number of tests). % rel. vol. diff., percent relative regional volume difference; WT, wild type; del, deletion; *, significant at p < 0.05; **, significant at p < 0.01; ***, significant at p < 0.001; §, significant at p < 0.05 Bonferroni-corrected for 104 brain regions.

