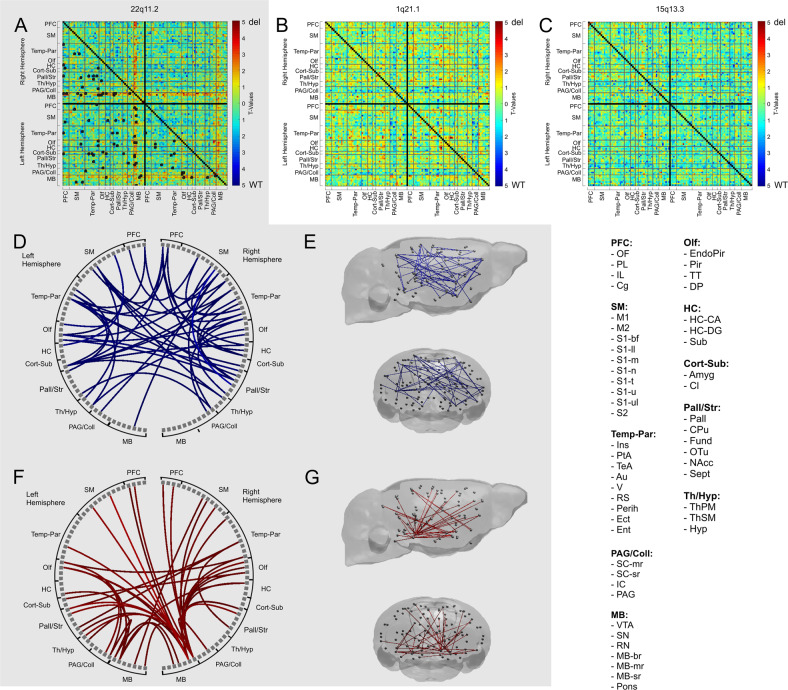
Fig. 3. Differences in functional connectivity (FC) between Df(h22q11)/+, Df(h1q21)/+, and Df(h15q13)/+ mice and their respective controls, detected by the network-based statistics (NBS) analyses.
The gray-shaded area represents results for the 22q11.2 deletion. a NBS analysis revealed a widespread cluster of FC differences in the Df(h22q11)/+ mice compared with its control (ppt < 0.01, pNBS < 0.05). Black boxes in the matrix represent the connections within the significant cluster at p < 0.05. b, c No significant group differences were detected between Df(h1q21)/+ or Df(h15q13)/+ mice and their respective controls in NBS analysis (pNBS ≥ 0.05). d, e The pattern of decreased FC in 22q11.2 deletion covered predominantly cortical brain regions. f, g The pattern of increased FC in 22q11.2 deletion was mostly restricted to mesocortical and mesolimbic pathways from the midbrain, with ventral tegmental area (VTA) and substantia nigra (SN) as main hubs. WT, wild type; del, deletion; PFC, prefrontal cortex; SM, sensory-motor areas; Temp-Par, temporo-parietal areas; PAG/Coll, periaqueductal gray and colliculi; Olf, olfactory areas; HC, hippocampal areas; Cort-Sub, cortical subplate; Pall/Str, pallidum and striatum; Th/Hyp, thalamus and hypothalamus. For the abbreviations of individual brain regions see legend for Fig. 1.

