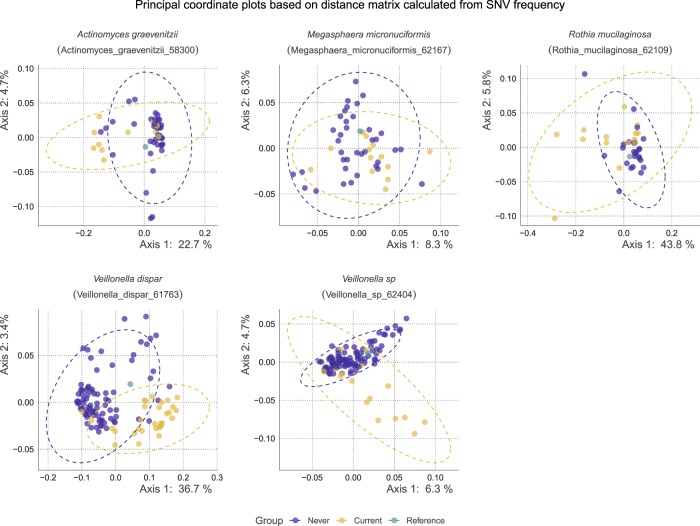
Fig. 5. The principal coordinate plots based on the distance matrix of species differed significantly between never and current smokers in terms of SNV frequency.
The x- and y-axes represent the first and second principal coordinates, respectively, with the proportion of variance. The points in blue indicate never smokers, while the points in yellow indicate current smokers, and the green points indicate the reference in the database.

