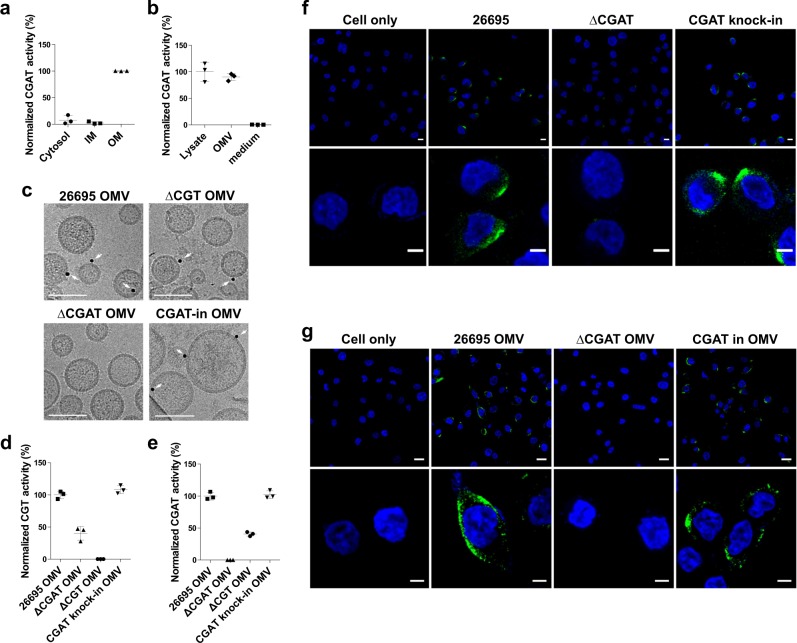
Fig. 2. Cellular location of CGAT.
a, b Cellular location of CGAT was determined by the enzyme activity. a IM and OM stand for the abbreviations of inner and outer membranes, respectively. See Methods section for the procedure to obtain the fractions of cytosol, IM, and OM of H. pylori 26695. b The three fractions were obtained from the same cell number of H. pylori 26695. These fractions were individually incubated for 2 h with the mixture of CG and PE at pH 4.5. The resulting CAG products were analyzed by LC-MS analysis. Data were obtained from three replicates. Data are shown as mean ± SD. c CGAT existing in OMVs was identified by cryo-transmission electron microscopy. OMVs were purified from different H. pylori strains and examined if they contained CGAT that is labeled by immune-gold (shown in black dots and indicated by white arrows). Scale bar: 50 nm. d, e Levels of CGT (d) and CGAT (e) activities in the OMVs that were purified from different H. pylori strains and determined by LC-MS analysis. Data are shown as mean ± SD. f CGAT was shown in the co-culture of AGS cells with different H. pylori strains. After co-culture with H. pylori for 8 h, the cells were fixed and stained with CGAT-specific antibody (Alexa Fluor 488, green). Nuclei were counterstained with DAPI (blue). Lower panels showed the magnified images from a part of upper panels. Scale bars denoted 20 (upper) and 5 (lower) μm. g CGAT was shown in the AGS cells with a prior treatment with or without H. pylori 26695 OMV, ΔCGAT OMV, or CGAT-knock-in OMV for 8 h. The cells were then stained as described in (f). Scale bars denote 20 (upper) and 5 (lower) μm. Data sources for a, b, d, and e are provided in Supplementary Data 1.

