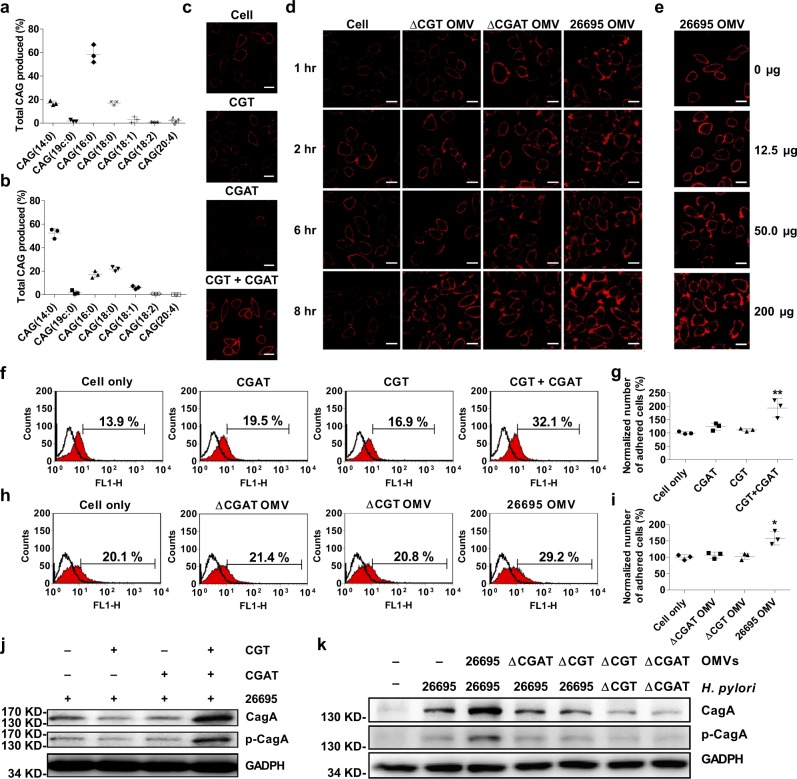
Fig. 3. Enhanced levels in lipid rafts clustering, adhesion, and CagA translocation by the concerted actions of CGAT and CGT.
a, b The compositions of CAGs in AGS cells after the cells were treated with both recombinant CGT and CGAT (a), or with the OMVs of H. pylori 26695 (b). c Enhanced level of lipid raft clustering was observed after AGS cells were treated with both recombinant CGT and CGAT for 8 h. Red fluorescence denotes the lipid rafts. Scale bar: 20 μm. d, e Time- and does-dependent confocal images of lipid raft clustering in AGS cells. d The images were obtained after the cells were treated with the purified OMVs (200 μg) from different H. pylori strains at 1, 2, 6, and 8 h. e The images were generated after the cells were treated with H. pylori 26695 OMVs for 8 h. Red fluorescence denotes the lipid rafts. Scale bar: 20 μm. f, h Enhanced H. pylori adherence to AGS cells after the cells were incubated with recombinant CGT or/and CGAT (f) or with the purified OMVs from different H. pylori strains (h). AGS cells were treated with the enzymes or OMVs for 8 h and then infected with H. pylori 26695 for another 1 h. Adherence was examined by flow cytometry analysis and shown as the proportion of adhered cells with H. pylori (%; shown in each plot). g, i Quantitation of the adhered cells of f and h was normalized in comparison with the negative control, respectively. All statistically significant differences are indicated with asterisks; **p < 0.01, *p < 0.05 vs. control group (n = 3). j, k Immunobloting analysis on CagA translocation and the related tyrosine phosphorylation to examine the effect of recombinant enzymes (j) or purified OMVs (k). The procedure was similar to that of f and h. The uncropped images are provided in Supplementary Fig. 4. In a, b, g and i, data are shown as mean ± SD and the data sources are provided in Supplementary Data 1.

