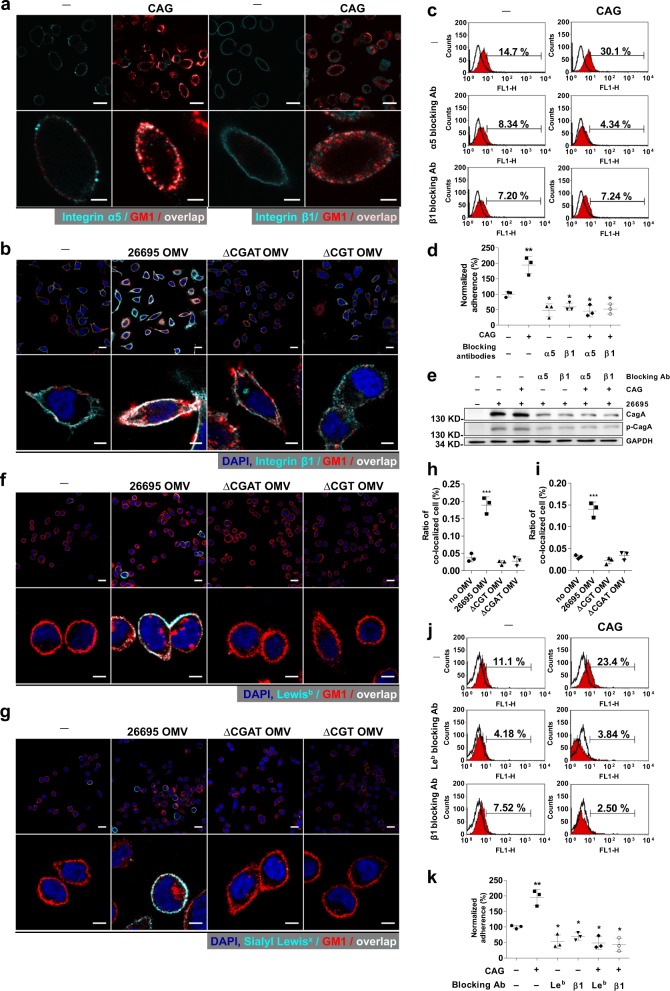
Fig. 4. Gathering of integrins α5/β1, Lewisb, and sialyl Lewisx by CAG or CAG-containing OMV in the rafts region.
a Integrins α5 and β1 and b Integrin β1 gathered at the rafts region by treatment of AGS cells with CAG (a) or with H. pylori 26695 OMVs (b). AGS cells were treated with CAG(18:0) for 1 h (a) or with OMVs for 8 h (b), and then fixed. Immunofluorescent staining was then applied to indicate lipid rafts (red), integrin α5 or β1 (cyan), and nuclei (blue). The co-localization of the first two is shown in color of fair pink. Scale bars: 20 (upper) and 5 (lower) μm. c–e Effects of integrin-blocking antibodies on H. pylori adhesion, CagA translocation, and the related tyrosine phosphorylation. AGS cells were treated with or without the integrin α5- or β1-blocking antibodies for 1 h, and incubated in the presence or absence of CAG(18:0) for additional 1 h, and then infected with H. pylori 26695. Adherence was measured by flow cytometry analysis (c) as the proportion of adhered cells with H. pylori (%; shown in each plot). The quantitation made in c was summarized in (d). Levels of CagA translocation and CagA tyrosine phosphorylation were detected by immunoblotting and shown in e. f, g Gathering of Lewisb (f) and sialyl Lewisx (g) in the rafts region by treatment of KATO III cells with H. pylori 26695 OMVs. The procedure and staining were similar to those of (b). Scale bars: 20 (upper) and 5 (lower) μm. h and i stand for quantitation of the confocal images made in f and g, respectively. j, k Effect of Lewisb-blocking antibodies on H. pylori adhesion. The procedure was similar to that of c and d. In d, h, i, and k, data are provided in Supplementary Data 1 and shown as mean ± SD and all statistically significant differences are indicated with asterisks; ***p < 0.001, **p < 0.01, *p < 0.05 vs. the control group (n = 3). Uncropped immunoblot images for e are provided in Supplementary Fig. 4.

