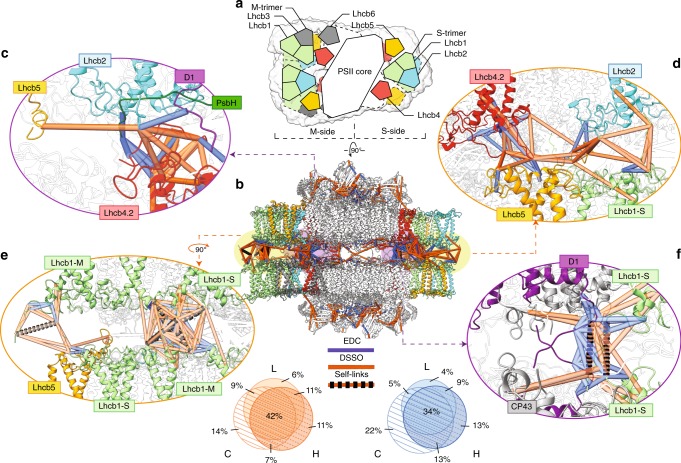
Fig. 3. Mapping of crosslinks in the paired PSII–LHCIIsc predicted structural model.
a Schematic top-view of the (C2S2M)×2 fitted in the cryo-EM map EMD-3825, showing the overall arrangement of the PSII–LHCIIsc subunits in the predicted models 1–3 (M-side and S-side are indicated). b Side-view with mapped crosslinks within the distance cut-off of 17 Å for EDC (blue lines) and 33 Å for DSSO (orange lines), and DSSO self-links (orange-black dashed lines). Venn diagrams showing the overlap between datasets of PSII–LHCIIsc L, C and H samples; only crosslinks present in at least two out of three samples were considered. The enlarged views highlight the crosslinks involving Lhcb2 (c, d) and Lhcb1 (e, f) at the periphery of the supercomplex (d, e) and close to the PSII core (c, f). Subunits are coloured as follows: Lhcb1 in light green; Lhcb2 in cyan; Lhcb4.2 in red; Lhcb5 in yellow; D1 in purple, PsbH in green and CP43 in grey. Subunits not involved in crosslinks are left transparent.

