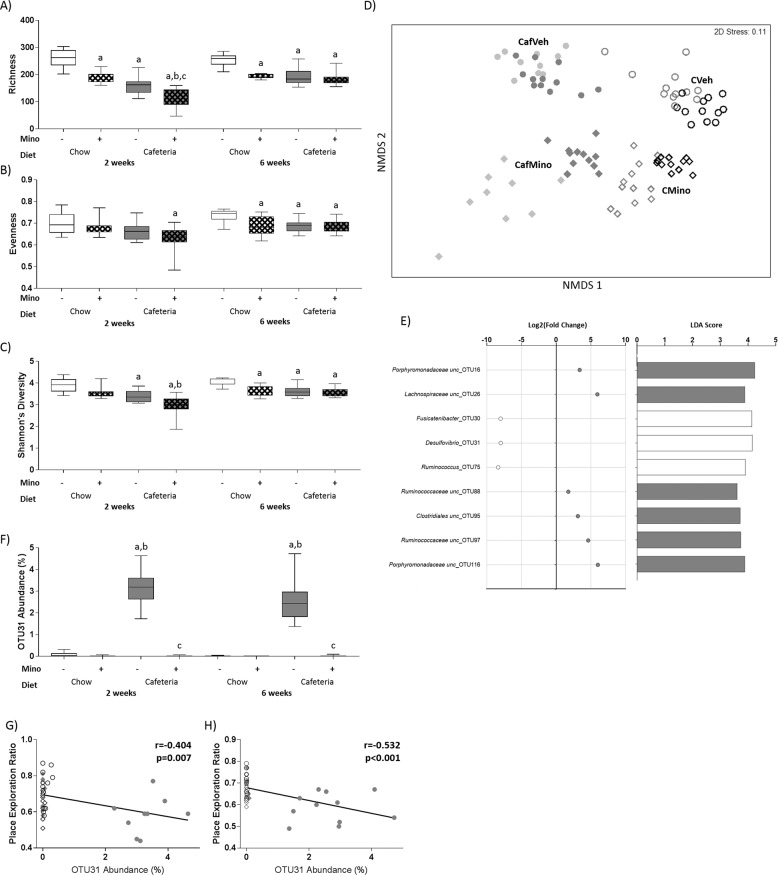
Fig. 3. Impact of cafeteria diet and minocycline on fecal microbiota at 6 weeks.
a Microbial species richness, b evenness, and c Shannon’s diversity at 2 and 6 weeks. Data expressed as box-and-whisker plots (min, IQR, max); n = 11–12 for individual measures; data were analyzed by three-way ANOVA followed by Tukey-adjusted post hoc testing. d Nonmetric multidimensional scaling (Bray–Curtis, 1000 permutations) showing similarity between fecal microbiota samples at 2 (light gray) and 6 (dark gray/black) weeks. e Selected OTUs identified by both DESeq2 (adjusted p < 0.05) and LEfSe (LDA score > 2, p < 0.05) as differentially abundant with minocycline in cafeteria-fed rats that are significantly correlated with place task performance. The color of the circle/bar denotes the group the OTU is enriched in (open: vehicle; gray: minocycline). Complete list in Supplementary Table 2. f Relative abundance of OTU31 at 2 and 6 weeks. Data expressed as box-and-whisker plots (min, IQR, max); n = 11–12 for individual measures; data were analyzed using Kruskal–Wallis test followed by nonparametric Dunn–Bonferroni post hoc testing. Scatterplots for place task performance and relative abundance of OTU31 at (g) 2 and (h) 6 weeks, showing overall lines of best fit; n = 46. Post hoc symbols: ap < 0.05 relative to CVeh, bp < 0.05 relative to CMino, cp < 0.05 relative to CafVeh.

