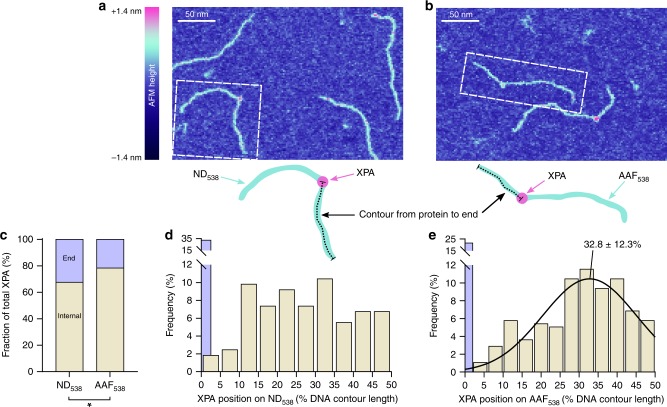
Fig. 1. XPA binds specifically to a dG-C8-AAF lesion.
a, b Representative AFM image of XPA bound to a non-damaged 538 bp DNA substrate (a, ND538) or a 538 bp DNA with a single dG-C8-AAF lesion at 30% from one end (b, AAF538). The dashed white line indicates the example in the cartoon below. Binding position was measured between the center of the protein to the closest DNA end as a percentage of total DNA contour length. c Percentage of XPA bound to DNA at ends (lavender) or internally (tan) on ND538 (n = 163 particles) and AAF538 (n = 277 particles). *p = 0.0118 by χ2 test. d Histogram showing the distribution of internally bound XPA (n = 110 particles) position on ND538. End-binders are shown in lavender. e Histogram and Gaussian fitting of internally bound XPA (n = 217 particles) positions on AAF538. End binders are shown in lavender (not included in Gaussian fit). Gaussian is labeled with mean and s.d.

