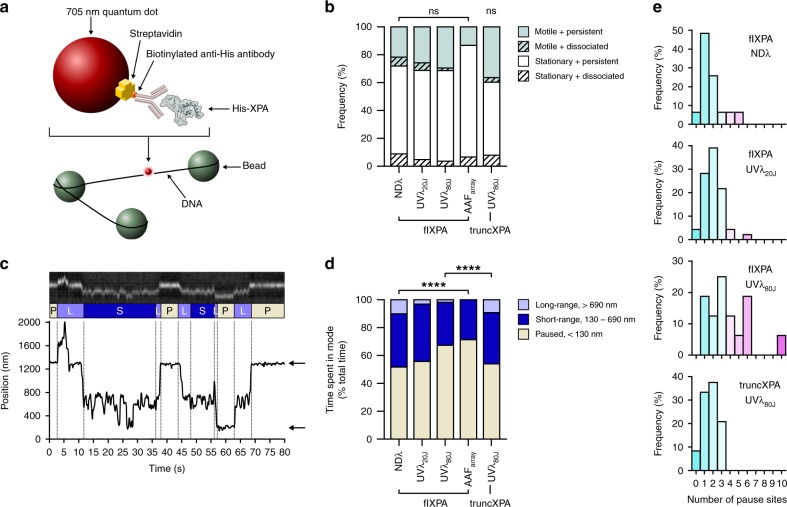
Fig. 5. XPA exhibits episodic linear diffusion on DNA tightropes. DNA damage leads to increased pausing, dependent on N- and C-termini.
a Cartoon showing one strategy used for XPA labeling on DNA tightropes. His-tagged XPA is labeled with a biotinylated anti-His antibody bound to a streptavidin-conjugated 705 nm quantum dot. See Methods for alternative labeling strategy. b Stacked bar graph showing the fraction of motile (teal) vs. stationary (white) and persistent (solid) vs. dissociating (diagonal lines) particles of full-length XPA (flXPA) on non-damaged λ (NDλ, n = 124 particles), 20 J/m2 UV-irradiated λ (UVλ20J, n = 147), 80 J/m2 UV-irradiated λ (UVλ80J, n = 54), and AAF arrays (AAFarray, n = 45), and of truncated XPA (truncXPA) on UVλ80J (n = 63). Motile particles are defined as those which moved more than 130 nm on DNA during 300 s observation. ns, no significant difference between groups by χ2 for all flXPA experiments, for all flXPA and truncXPA categories, or for truncXPA on UVλ80J vs. flXPA on UVλ80J. c Example of a kymograph (cut to show only 80 s of the recorded movie) of motile 705 nm quantum dot-labeled flXPA on NDλ. Particle position (bottom) was localized using Gaussian fittings to the intensity profile on the fluorescence image (top). Dashed lines separate phases and diffusive modes are labeled according to particle displacement: paused (P, displacement <130 nm, tan), short-range motion (S, displacement 130–690 nm, navy), and long-range motion (L, displacement > 690 nm, lavender). Arrows point to pause sites occupied by particle. d Stacked bar graph showing the fraction of time spent in each mode as percentage of total time recorded for all motile particles. ****p < 0.0001 by χ2 for all flXPA experiments and for truncXPA on UVλ80J vs. flXPA on UVλ80J. e Histogram of number of pause sites for flXPA on NDλ (n = 31 particles), UVλ20J (n = 46), and UVλ80J (n = 16), and for truncXPA on UVλ80J (n = 24).

