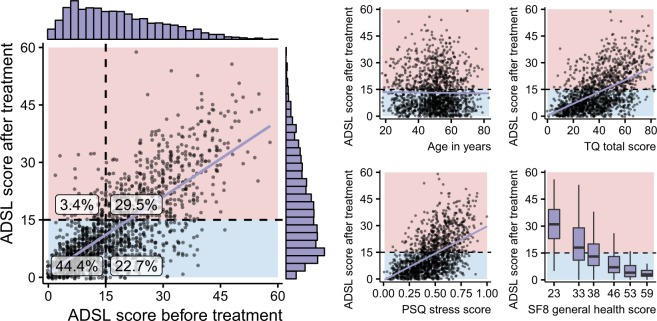
Figure 2.
Relationship between depression score after therapy and other features. Graphical representation of the relationship between the ADSL depression score at the end of therapy (y-axis) with other features (x-axis). Higher values on y-axis represent higher depression severity. Background color represents subclinical (blue) or clinical (red) depression status at the end of therapy. Slight jittering was applied to the points to mitigate overplotting. Marginal histograms depict univariate feature distributions.

