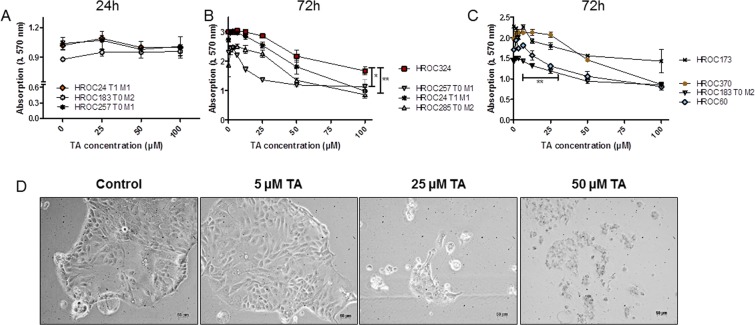
Figure 1.
Crystal violet staining and morphology of cell lines treated with increasing doses of TA. (A–C) Quantitative analysis of adherent cells upon (A) 24 hours and (B,C) 72 hours of treatment. Untreated cells were used as controls. TA reduced cell growth of different patient-derived CRC cell lines in a dose-dependent manner. Results show data of three independent experiments. Mean ± SD. **p = 0.0065 HROC257 T1 M1 vs. HROC324; p = 0.0259 HROC285 T0 M2 vs. HROC324, **p = 0.0071 HROC183 T0 M2 vs. HROC370; two-tailed t-test. (D) Light microscopy of HROC285 T0 M2 cells after 72 h treatment with increasing TA concentrations. 1 × 10⁴ cells were seeded and after overnight incubation treated with different concentrations of TA. Pictures were taken 72 h after treatment.

