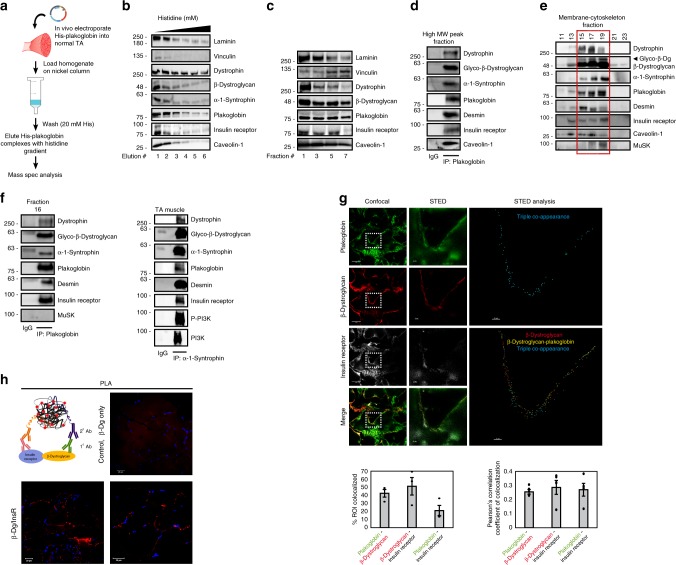
Fig. 2. Plakoglobin binds DGC components and insulin receptors at costameres on the plasma membrane.
a Affinity-based purification of plakoglobin-containing complex. 6His-tagged plakoglobin encoding plasmid was electroporated into muscle, and 6His-plakoglobin-bound proteins were isolated with Nickel beads and identified by mass spectrometry. b 6His-plakoglobin-bound proteins were eluted from Nickel column with histidine gradient (50–250 mM) and analyzed by immunoblotting. Fraction #2 was subjected to mass spectrometry. n = one experiment, data were compared to Fig. 1g, h. c Analysis of high MW protein fractions (as in Fig. 1c) by immunoblotting. n = two independent experiments. d Plakoglobin immunoprecipitation from the high MW protein peak. Bound proteins were detected by immunoblotting. e Plakoglobin, DGC components (including glycosylated-β-dystroglycan), the insulin receptor, caveolin-1, desmin, and MuSK sediment to the same glycerol gradient fractions (marked by a red rectangle). Membrane-cytoskeleton fraction from mouse muscle was analyzed by 10–40% glycerol gradient and immunoblotting. n = two independent experiments. f In normal muscle, plakoglobin, DGC components, the insulin receptor, and desmin interact. Left: Proteins co-purified with anti-plakoglobin from fraction #16 in e, and detected by immunoblotting. MuSK did not bind plakoglobin, although it sedimented to the same fractions. Right: Reciprocal immunoprecipitation with α-1-syntrophin antibody from membrane fractions isolated from normal muscle. Two experiments were performed: One with plakoglobin antibody and one with α-1-syntrophin antibody. g Plakoglobin, β-dystroglycan, and the insulin receptor potentially colocalize at costameres on the skeletal muscle membrane. STED: Stimulated emission depletion microscopy. Confocal (bar, 5 μm) and STED (bar, 2 μm) images of muscle cross-sections stained with the indicated antibodies. n = three independent experiments. STED analysis was performed using the spots module of the Imaris software for the three proteins. The double and triple co-occurrence spots are presented in yellow (plakoglobin-β-dystroglycan) and blue (plakoglobin-β-dystroglycan-insulin receptor). Right: Percent colocalization of indicated proteins in region of interest (the region of co-occurrence, confocal images), and the corresponding Pearson’s correlation coefficients of colocalization. n = 3, and two independent experiments. Data are represented as mean ± SEM. h Proximity ligation assay (PLA) was performed on TA cross-sections with β-dystroglycan and insulin receptor antibodies or β-dystroglycan antibody alone. Red fluorescent dots indicate areas of β-dystroglycan-insulin receptor association.

