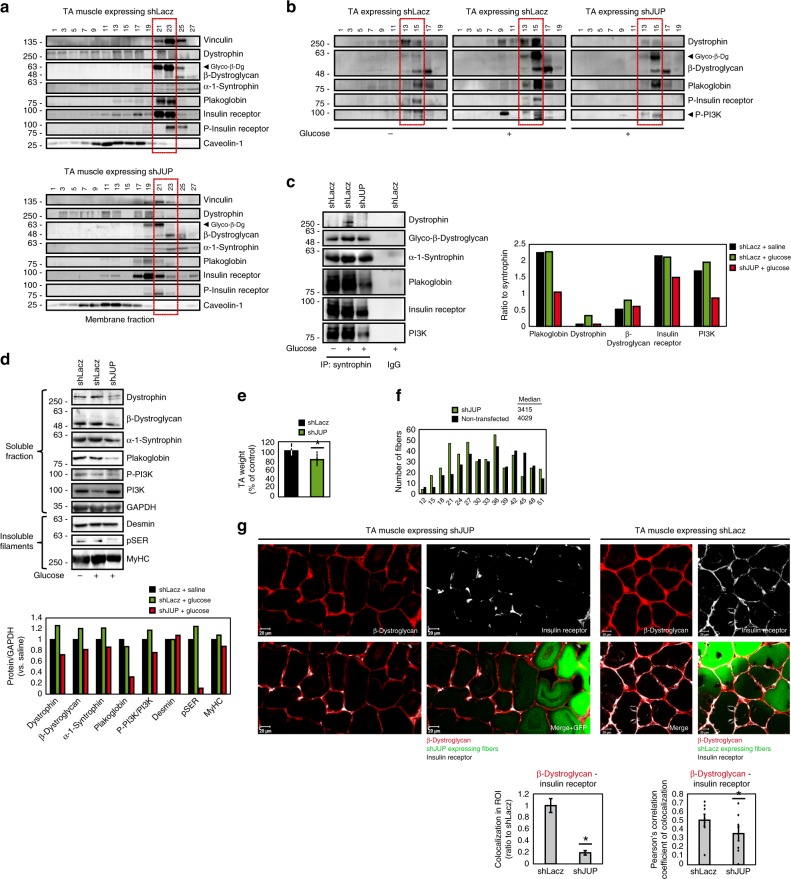
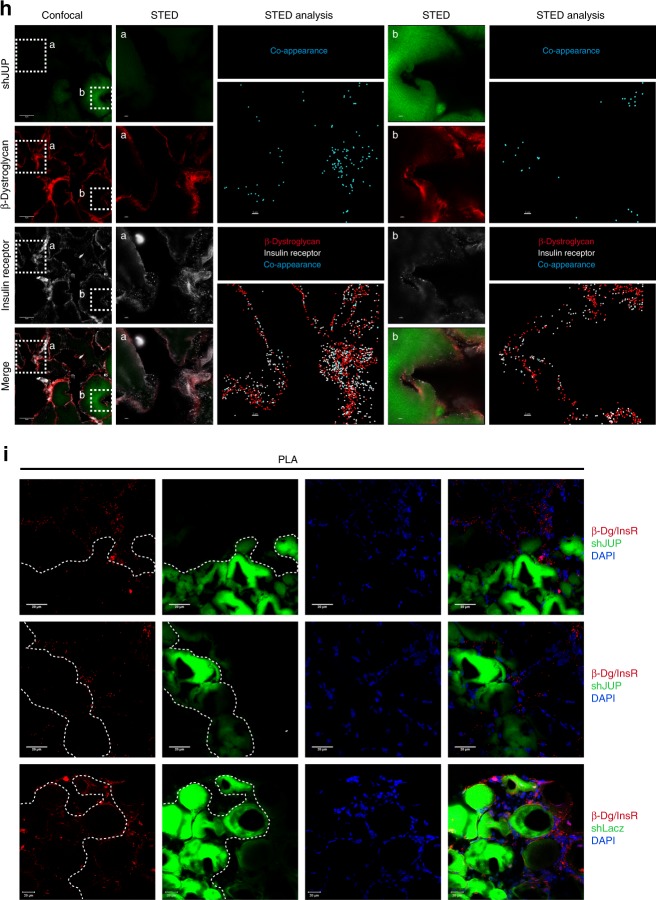
Fig. 3. Plakoglobin downregulation reduces DGC-insulin receptor association and insulin signaling, and causes atrophy.
Contralateral muscles from fasted mice were electroporated with plakoglobin shRNA (shJUP) or control shRNA (shLacz). Red rectangle marks fractions containing glycosylated-β-dystroglycan in shLacz-expressing muscles. STED: Stimulated emission depletion microscopy. a Muscle membrane extracts were analyzed by glycerol gradients and immunobloting. n = three independent experiments. b Mice were injected with saline or glucose (1 mg/g body weight) and muscle membrane extracts were analyzed by glycerol gradient and immunoblotting. n = three independent experiments. c Syntrophin immunoprecipitation from muscle membrane extracts from mice injected with saline or glucose (1 mg/g body weight). Precipitates were analyzed by immunoblotting. Right: Densitometric measurements of presented blots. Graph depicts ratio of each protein to syntrophin. n = two independent experiments. d Soluble fractions of transfected muscles from mice injected with saline or glucose were analyzed by immunobloting. n = two independent experiments. e Mean weights of muscles expressing shJUP are plotted as the percentage of shLacz muscles. Data are represented as mean ± SEM. n = 14 mice; *P < 0.00005 by one-tailed t test. n = two independent experiments. f Cross-sectional areas of 521 fibers expressing shJUP (also express GFP, green bars) vs. 521 non-transfected fibers (black bars). n = 4 mice. g Top: Representative confocal images of transfected muscles cross-sections (also express GFP), stained with anti-insulin receptor and anti-β-dystroglycan. Bar, 20 μm. n = two independent experiments. Bottom: Colocalization of β-dystroglycan and insulin receptor in region of interest (the region of co-occurrence, data are presented as ratio to shLacz), and the corresponding Pearson’s correlation coefficients of colocalization. n = 8, two independent experiments. *P < 0.05 vs. shLacz, by one-tailed t test. Data are represented as mean ± SEM. h Confocal (bar, 5 μm) and STED (bar, 2 μm) images of cross-sections of transfected muscles stained with the indicated antibodies. n = two independent experiments. STED analysis was performed using the spots module of the Imaris software for β-dystroglycan and insulin receptor (white and red spheres, respectively). β-Dystroglycan-insulin receptor co-occurrence is in blue. i Proximity ligation assay (PLA) was performed on cross-sections of transfected muscles stained with β-dystroglycan and insulin receptor antibodies. Red fluorescent dots indicate areas of β-dystroglycan-insulin receptor association.


