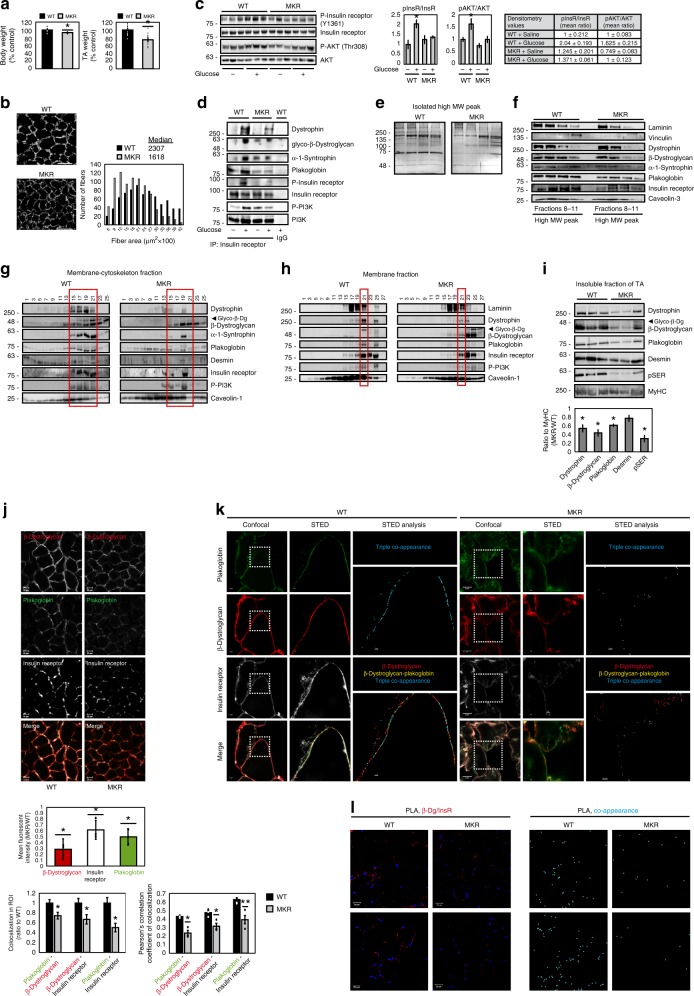
Fig. 4. In MKR mouse muscles insulin receptor-DGC association is reduced.
a Mean body (n = 5) and TA (n = 12) weights of MKR mice at 8 weeks old are presented as percentage of WT. *P < 0.05, by one-tailed t test. Data are mean ± SEM. n = two independent experiments. b Left: Laminin staining (white). Bar, 50 μm. Right: Cross-sectional areas of 834 fibers from WT (black bars) and MKR (gray bars) mice. n = 3 mice. c Left: Soluble fractions of mouse muscles injected with saline or glucose were analyzed by immunoblotting. n = two independent experiments. Right: Densitometric measurement of presented blots. d Insulin receptor immunoprecipitation from muscle membranes of mice injected with saline or glucose. n = two independent experiments. e, f High MW protein peak fractions isolated from mouse muscles were analyzed by silver staining and immunoblotting. n = three independent experiments. g Membrane-cytoskeleton fractions from mouse muscles were analyzed by glycerol gradients. Red rectangle marks fractions containing glycosylated-β-dystroglycan in WT. n = two independent experiments. h Isolated mouse muscle membranes were analyzed by glycerol gradients. n = two independent experiments. Red rectangle marks fractions containing glycosylated-β-dystroglycan in WT. i Top: Muscle insoluble fractions were analyzed by immunoblotting. n = two independent experiments. Bottom: Densitometric measurement of presented blots. j Top: Muscle cross-sections were stained with plakoglobin, β-dystroglycan, and insulin receptor antibodies. Bar, 20 μm. n = three independent experiments. Middle: Fluorescent intensity was quantified using the Imaris software. Bottom: Colocalization of indicated proteins in region of interest (region of co-occurrence, data are ratio to WT), and the corresponding Pearson’s correlation coefficients of colocalization. n = 6, and two independent experiments. *P < 0.05 and **P < 0.005 vs. WT, by one-tailed t test. Data are mean ± SEM. k STED: Stimulated emission depletion microscopy. Confocal (bar, 5 μm) and STED (bar, 2 μm) images of muscles cross-sections stained with indicated antibodies. n = two independent experiments. STED analysis was performed using the spots module of Imaris software for the three proteins. The double and triple co-occurrence spots are presented in yellow (plakoglobin-β-dystroglycan) and blue (plakoglobin-β-dystroglycan-insulin receptor). l Proximity ligation assay (PLA) was performed on muscle cross-sections stained with β-dystroglycan and insulin receptor antibodies. Red fluorescent dots (left) and blue dot analysis (right) indicate areas of β-dystroglycan-insulin receptor association.

