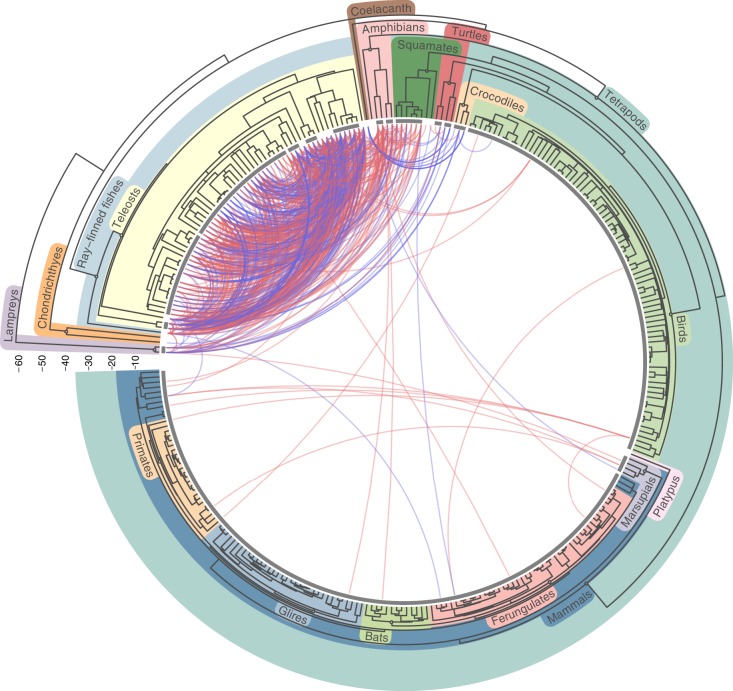
Fig. 2. Horizontal transfer of transposable elements among vertebrates.
The concave tree represents the time-based phylogeny of the 307 analyzed species and was retrieved from timetree.org (50). Each curve represents one of the 975 independent HTT events we inferred. It connects the two species involved in the hit of highest sequence identity in the transfer. Blue curves represent HTT of retrotransposons (Class-I TEs) and red curves HTT of DNA transposons (Class-II TEs). The horizontal scale on the left shows ages in 10 My. Gray lines above tips span clades that are less than 120 My old, within which HTT was not inferred.

