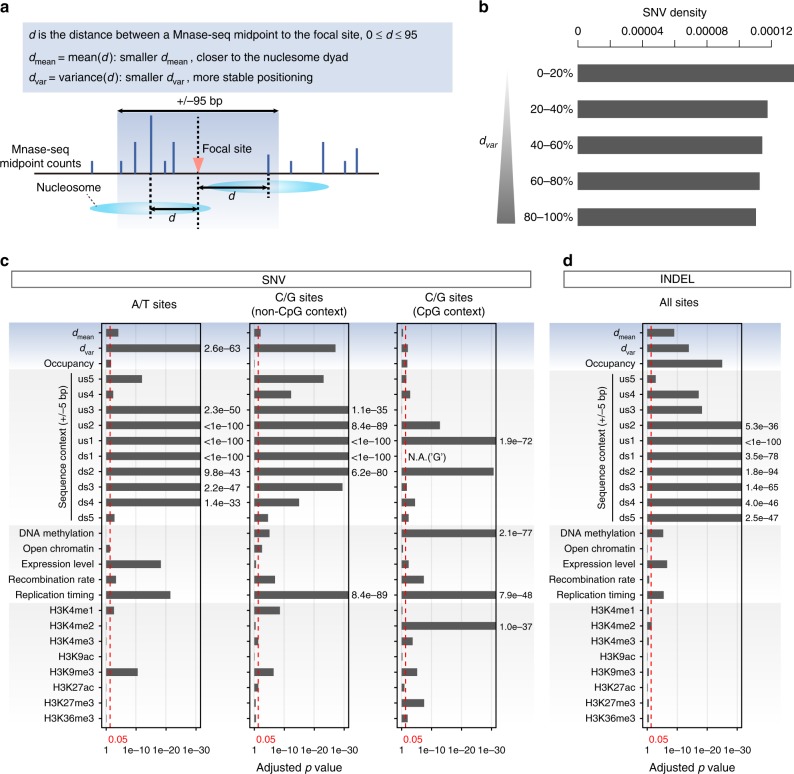
Fig. 2. Evaluating the contribution of nucleosome organization to mutation rate variation.
a Schematic diagram describing two nucleosome positioning-related variables (dmean and dvar) relative to a given genomic position. b Classifying the genome into five equal portions by dvar and calculating the SNV densities. c, d Independent statistical significance of potential contributing factors to mutation rate variation, having controlled for other factors; b for SNVs and c INDELs. Tests for SNVs were performed separately at A/T and C/G sites (non-CpG and CpG contexts, respectively). Vertical red lines indicate the threshold for statistical significance (0.05). The p values were from the likelihood-ratio tests and were adjusted for multiple testing with Benjamini–Hochberg correction. us upstream; ds downstream. Source data are provided as a Source Data file.

