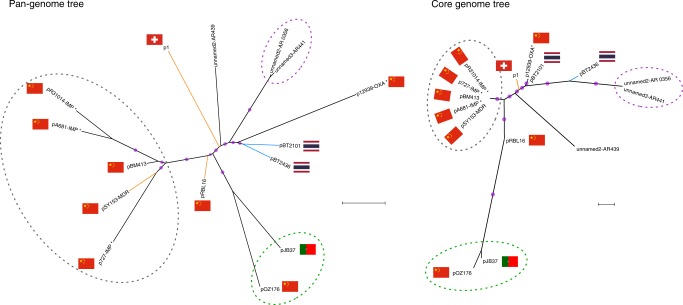
Fig. 4. Phylogenomic analysis of complete megaplasmids of the pBT2436-like family.
Maximum-likelihood unrooted phylogenetic trees displaying the relationships among the megaplasmids reported in this work (blue branches) and 13 Pseudomonas homologous plasmids detected in GenBank. Branches corresponding to plasmids from non-aeruginosa species are coloured in orange. Pangenome phylogeny (left) was estimated from the pangenome matrix and reflects the evolutionary relationship of the megaplasmids in terms of their gene content, i.e. presence/absence patterns of the 1164 clusters contained in the matrix. The core genome phylogeny (right) was estimated from the concatenated set of 105 top-ranking alignments from core genes selected as phylogenetic markers and depicts the patterns of divergence of the megaplasmid genomic backbone. Taxa clustered together in both trees are highlighted with dotted-line ovals of matching colours. Purple dots represent approximate Bayesian posterior probability values >0.99 or >0.81 for the corresponding nodes in the core genome and pangenome trees, respectively. Scale bars correspond to 0.1 expected substitutions per site under the binary GTR+FO (pangenome tree) or best-fitting GTR+F+ASC+R2 (core genome tree) models. Where known, sources are indicated by nation flags. Asterisks in plasmid names denote cases where the geographical source is putative, based on the information of the submitter’s country in GenBank.

