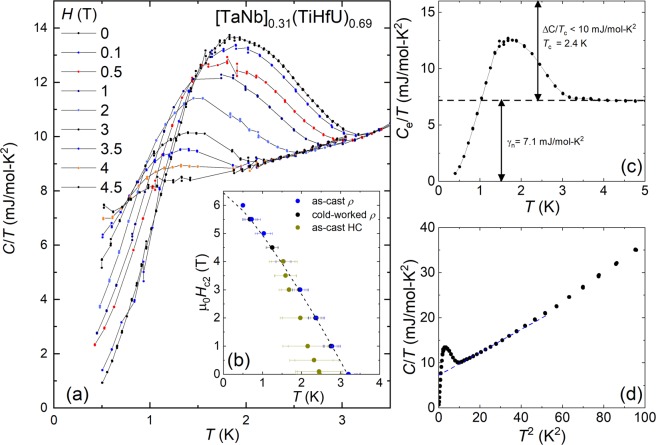
Figure 3.
Heat capacity data for [TaNb]0.31(TiUHf)0.69. (a) Temperature dependent heat capacity measurements for temperatures T = 0.5–3.5 K and magnetic fields H = 0–4.5 T. The bulk superconducting phase transition at Tc is seen as a broadened lambda-like peak that is suppressed with increasing H. (b) The upper critical field Hc2 vs T defined both from the lambda feature in the heat capacity and as the 50% value of the electrical resistivity (see Fig. 2). Results are shown both for an as-cast sample and for a piece that was cold worked under liquid nitrogen into a thin sheet. The dotted line is a fit to the data, as described in the text. (c) The electric contribution to the heat capacity divided by T, where the phonon contribution (shown in panel d as a dotted line) has been subtracted. The electronic coefficient of the heat capacity γ and the size of the jump ΔC/Tc are shown. (d) C/T vs. T2 showing that over a broad T range the data are described by the expression γ + βT2.

