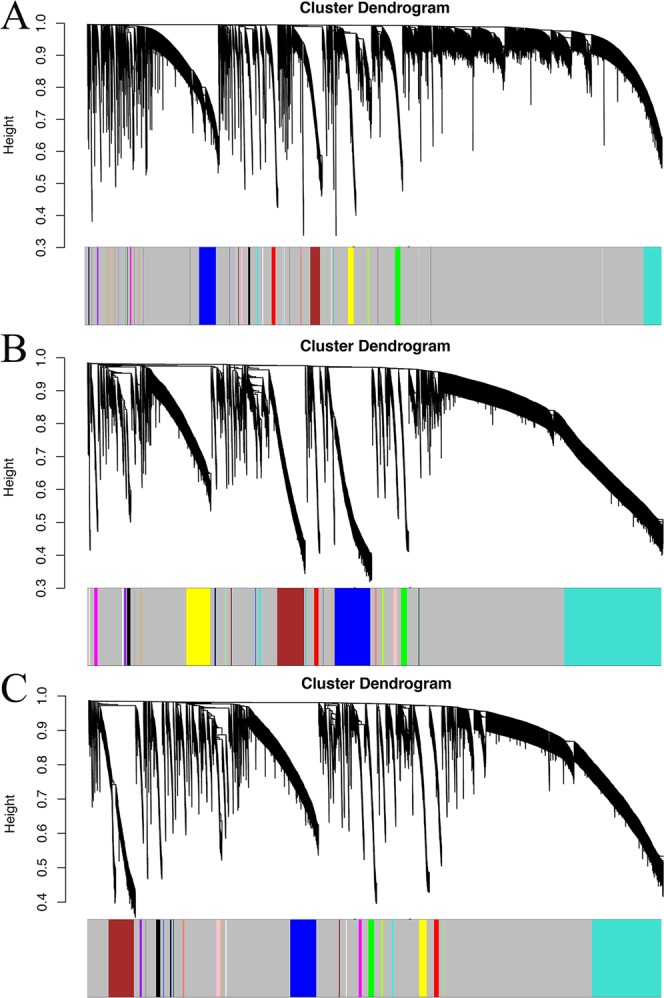
Figure 10.

Visual Representations of the Gene Co-Expression Network. Hierarchical clustering of all differentially expressed genes and visualization of gene module partitioning. The colored bars (bottom) directly correspond to the different module (color) of the gene cluster. We eliminated the interfering genes by adjusting the screening criteria. (A) (log Fold Changeå 1, P-value <0.05), (B) (log Fold Changeå 2, P-value <0.05) and Fig. 11C (log Fold Changeå 2, P-value <0.01). In order to narrow the prediction range of the co-expression network, and to more accurately find the target gene with co-expression relationship with hsa-mir-3923.
