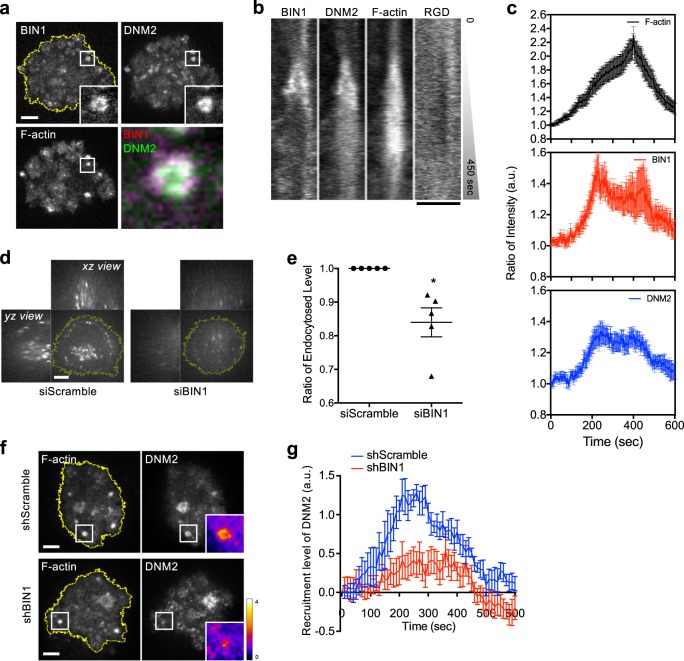
Fig. 6. BIN1 recruits DNM2 to the podosome ring and promotes RGD endocytosis.
a BIN1-mCherry colocalizes with DNM2-GFP at the podosome ring. F-actin is labeled by BPF2-UtrCH in REF52 cell. Inset: the boxed region (4 × 4 μm2) (see Supplementary Movie 5). b Kymograph of the boxed region of a. BIN1 and DNM2 are enriched at the podosome ring in the early phase of podosome formation. c Intensity analyses of BIN1 and DNM2 at the podosome ring. All intensity traces are synchronized by realigning F-actin peak intensity at 400 s. BIN1 and DNM2 both reach the peak intensity before F-actin. Eighteen podosomes from nine cells in three independent experiments are analyzed. d, e Knockdown of BIN1 suppresses RGD-NA488 endocytosis. Three-dimensional confocal images are shown with the z position from 2 to 20 µm (xz and yz view, 500 nm z-step), while the image shown in xy view is at the z position of 5 µm above the adhesion plane. Statistical information is in Supplementary Fig. 10g. f Knockdown of BIN1 by shRNA suppresses the recruitment of DNM2-GFP to the podosome ring. Inset: the boxed region (5 × 5 μm2). Ratiometric insets of DNM2 indicate the recruitment level (see Supplementary Movie 6). g Recruitment level of DNM2-GFP during podosome formation. The recruitment of DNM2 to the podosome ring is reduced when BIN1 expression is suppressed. All intensity traces are synchronized by realigning F-actin peak intensity at 400 s. shScramble samples are analyzed from nine podosomes from six cells in four independent experiments. shBIN1 samples are analyzed from 12 podosomes from seven cells in five independent experiments. Scale bars represent 5 µm. Error estimates are SEM.

