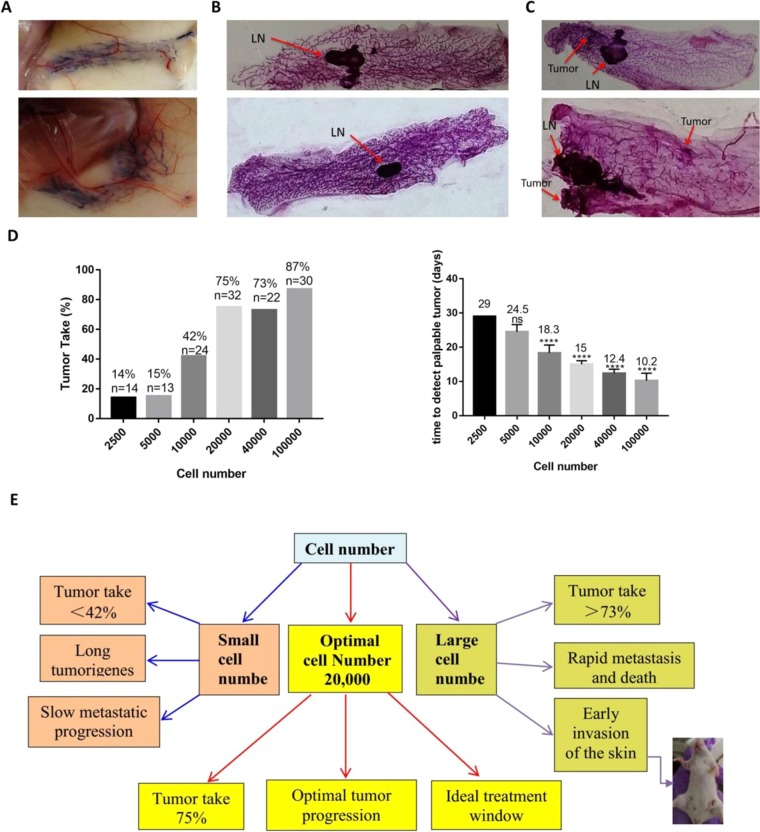
Figure 1.
Determination of optimal cell number during development of the metastatic mouse model. (A) Representative photograph of injection of 0.2% trypan blue cells into the mammary glands of mice. (B) Representative photograph of the whole mount of the 4th inguinal mammary glands of female BALB/C mice injected with 20,000 4T1 cells for 1 week (n = 5). LN: lymph node. (C) Representative photograph of the whole mount of the 4th inguinal mammary glands of female BALB/C mice injected with 4T1 cells for 2 weeks (n = 5). LN: lymph node. (D) Rate of tumor formation and time of tumor formation after injection with different numbers of cells. ns. not significant, ****p < 0.0001. (E) Consequences of different numbers of injected cells.

