Figure 4.
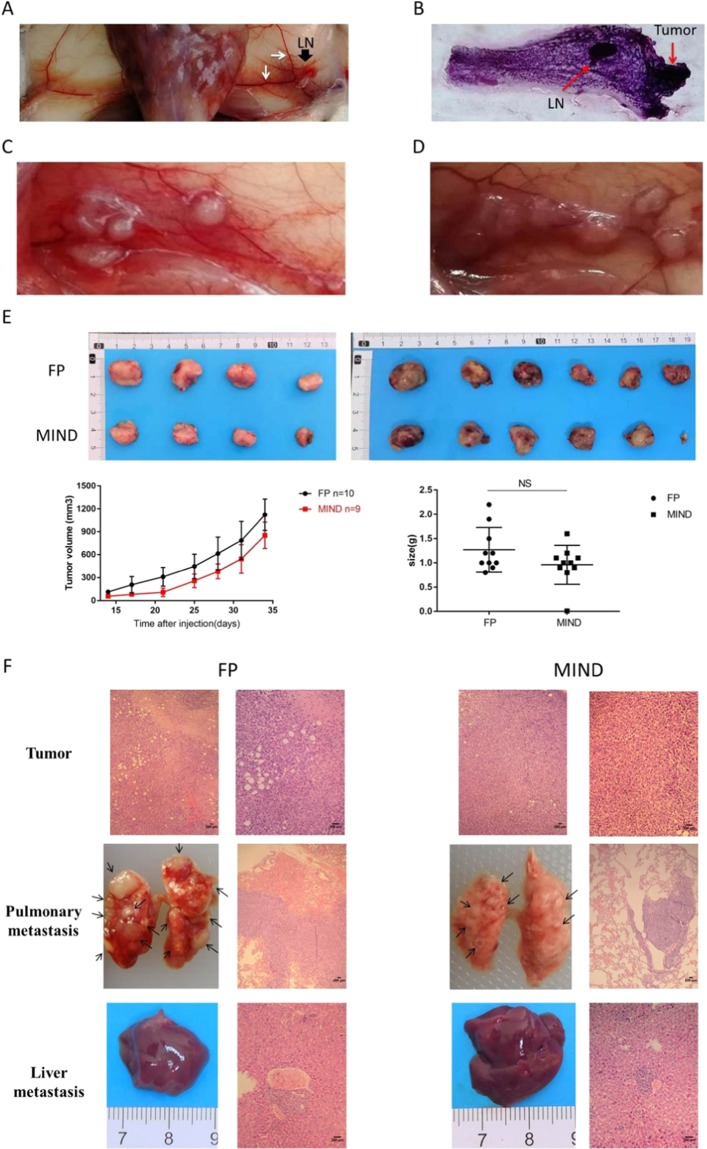
Tumor Progression in the 4T1 MIND Model. (A) Representative photograph of the 4th inguinal mammary glands of female BALB/C mice injected with 4T1 cells for 1 week (n = 5). Mammary ductal enlargement and lymphadenopathy and enlarged mammary vessels appeared. LN (black arrow): lymph node; white arrow: mammary vessels. (B) Representative photograph of the whole mount of the 4th inguinal mammary glands of female BALB/C mice injected with 4T1 cells for 2 weeks (n = 5). LN: lymph node. (C,D) Representative photograph of 4th inguinal mammary glands with tumor (T) of female BALB/C mice injected with 4T1 cells for three week (n = 5) and four week (n = 5). The photograph illustrates tumor growth in the mammary ducts. (E) Comparison of the two methods of tumor cell injection on primary tumor growth, following injection of 20,000 cells directly into the fat pad (FP) or via the MIND method. The growth curve and tumor weight of the two groups were compared 5 weeks after injection. (F) Representative photograph of transplanted tumor, lung metastasis and liver metastasis in female BALB/C mice of FP and MIND groups after injection of 20000 4T1 cells for 5 weeks. Scale bar, 200 μm.

