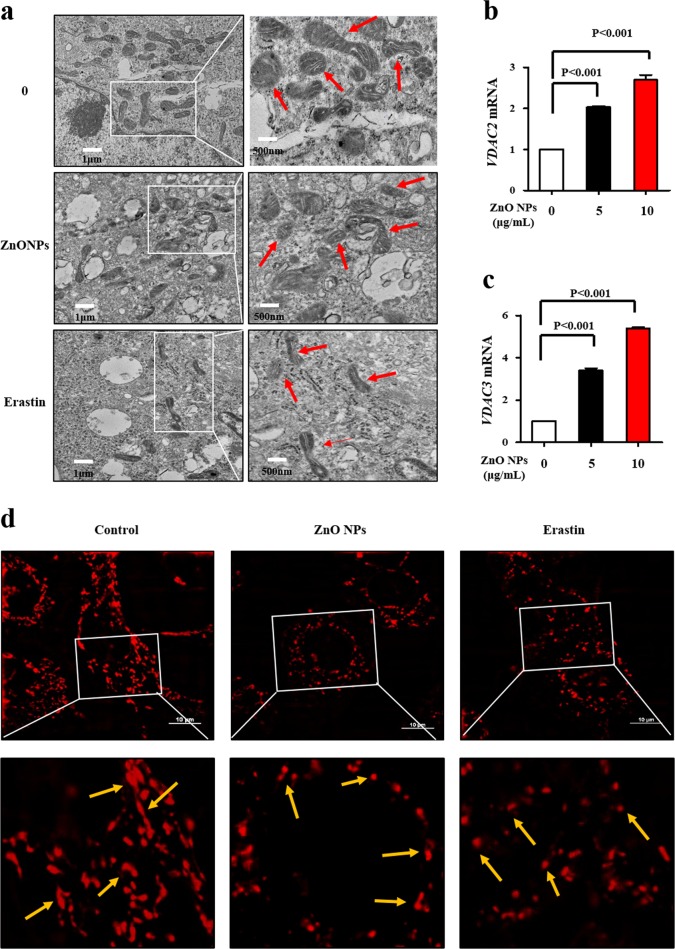
Fig. 3. ZnO NPs exposure dysregulates mitochondrial dynamics.
HUVECs were treated with ZnO NPs (10 μg/mL) or erastin (25 μM) for 24 h. a Typical TEM morphological images of ZnO NPs or erastin-treated cells. Scale bar = 1 μm. Total RNA was extracted for the analysis of (b) VDAC2 and (c) VDAC3 mRNA levels using qRT-PCR. d Representative MitoTracker ® Deep Red FM staining (50 nM) to assess the mitochondrial morphology in HUVECs. Cells were subjected to super-resolution confocal microscopy. Scale bar = 10 μm. Data are shown as the mean ± S.D. of three independent experiments.

