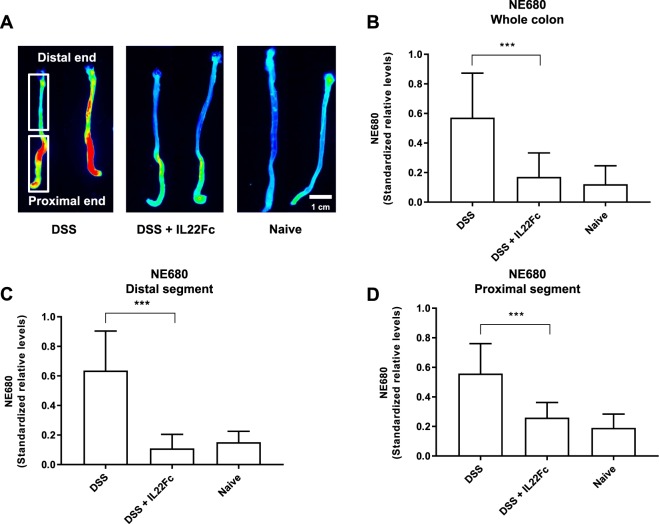
Figure 4.
Neutrophil Elastase 680 ex vivo colon imaging. (A) Resected mouse colon highlighting different levels of neutrophil activity by treatment group. (B) Whole organ ROI analysis show decrease in NE680 signal for DSS + IL22Fc treated animals. (C,D) Segmented analysis of distal and proximal colon. For DSS, n = 20; for DSS + IL22Fc, n = 20; for naive, n = 20. All values presented are the mean ± S.D. One-way ANOVA was used to analyze variation; ***P < 0.001.

