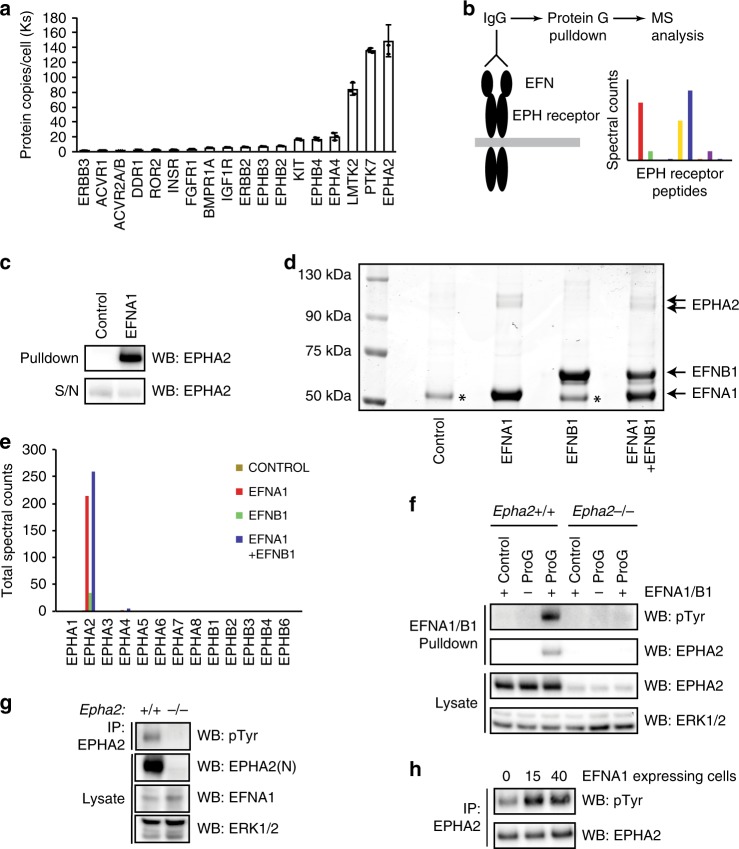
Fig. 2. EPHA2 is critical for EFN ligand responses in mESCs.
a Average protein copy number per cell determined for receptor kinases in mESCs, using quantitative whole-cell proteomics. Data are presented as mean ± SD (n = 3). b Workflow for quantification of EPH–EFN interactions in mESCs by EFN ligand affinity purification mass spectrometry. c Proof-of-principle identification of EPH–EFN interactions by EFN ligand affinity purification. EPHA2 levels were determined by immunoblotting. d Coomassie staining of EFNA1/B1 affinity purification from mESCs. EFNA1, EFNB1 and EPHA2 proteins are indicated. (*) = non-specific band. e Mass-spectrometry analysis of 75–130-kDa region of the Coomassie stained EFNA1/EFNB1 affinity purification shown in (d). Total spectral counts recovered for each EPH receptor family member are indicated. f EFNA1/B1 affinity purification from intact Epha2+/+ and pooled Epha2−/− mESCs. Phosphotyrosine (pTyr), EPHA2 and ERK1/2 levels were determined by immunoblotting. Note that the pTyr signal is specific for EPHA2, and is not detected in the absence of EFN ligand. g EPHA2 was immunoprecipitated from Epha2+/+ and Epha2−/− mESCs, and pTyr, EPHA2, EFNA1 and ERK1/2 levels determined by immunoblotting. h Epha2+/+ mESCs were stimulated with EFNA1-expressing Epha2−/− mESCs for 15 or 40 min. EPHA2 was immunoprecipitated, and pTyr and EPHA2 levels determined by immunoblotting. Source data are provided as a Source Data file.

