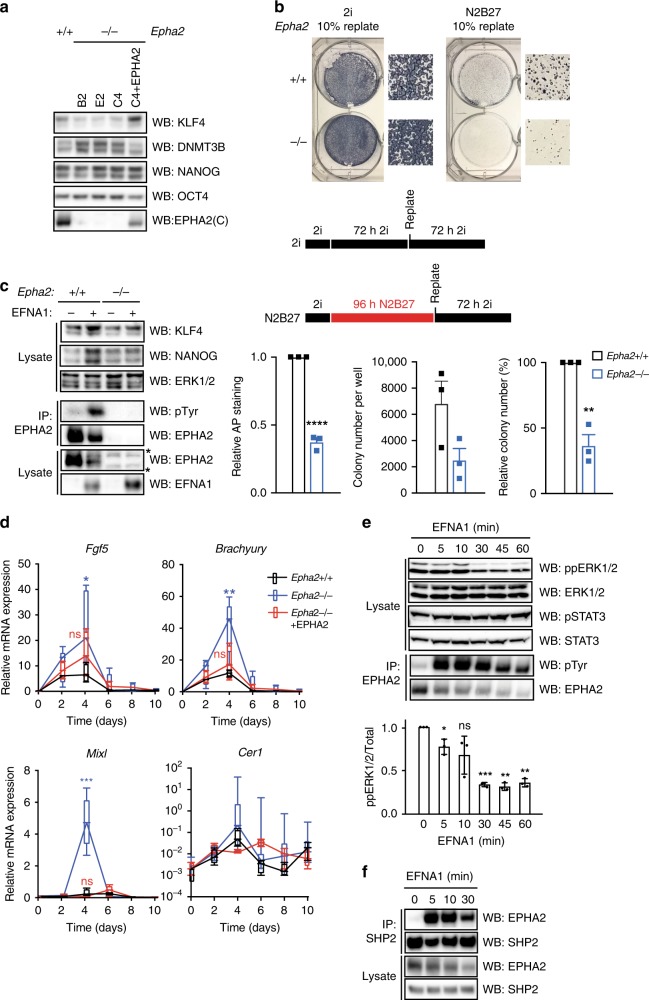
Fig. 3. EFNA1-activated EPHA2 supports mESC pluripotency and restricts commitment to differentiation by suppressing ERK1/2 signalling.
a Epha2+/+, Epha2−/− or Epha2−/− mESCs (clone C4) stably expressing EPHA2 were cultured in the absence of LIF for 48 h. EPHA2, KLF4, DNMT3B, NANOG and OCT4 levels were determined by immunoblotting. b Epha2+/+ or Epha2−/− (clone C4) mESCs were maintained in 2i or differentiated in N2B27 media for 72 or 96 h, respectively, whereupon 10% of cells were replated in 2i. Total alkaline phosphatase staining is represented relative to Epha2+/+ mESCs. The total number of alkaline phosphatase-positive colonies for Epha2+/+ and Epha2−/− mESCs is shown, and also represented relative to Epha2+/+ mESCs. Data show mean ± SEM (n = 3); statistical significance was determined using unpaired two-sided Student’s t test comparing Epha2−/− with the Epha2+/+ control (****P < 0.0001, **P = 0.0016). c Epha2+/+ or Epha2−/− (clone C4) mESCs stably expressing EFNA1, along with the respective parental controls, were grown in LIF/FBS, and KLF4, NANOG, EPHA2, EFNA1 and ERK1/2 levels determined by immunoblotting, or EPHA2 immunoprecipitated and pTyr and EPHA2 levels determined by immunoblotting. d Epha2+/+, Epha2−/− or Epha2−/− mESCs stably expressing EPHA2 were differentiated as embryoid bodies for 10 days, and the levels of Fgf5, Brachyury, Mixl and Cer1 mRNA determined by qRT-PCR. Box-and-whisker plots show median, first and third quartiles, and maximum and minimum values. The results shown are for technical replicates from two independent experiments, including three Epha2−/− clones (n = 3); statistical significance at day 4 was determined using unpaired two-sided Student’s t test comparing each group with the Epha2+/+ control (ns = not significant, *P = 0.0252, **P = 0.0045, ***P < 0.0001). e Epha2+/+ mESCs cultured in LIF/FBS were stimulated with 1 μg/ml clustered EFNA1 for the indicated times. ppERK1/2, total ERK1/2, STAT3 pY705 and total STAT3 levels were determined by immunoblotting. EPHA2 was immunoprecipitated, and pTyr and EPHA2 levels determined by immunoblotting. ppERK1/2 signal was quantified; data show mean ± SD (n = 3); statistical significance was determined using one-sample two-sided t test comparing each group with control, theoretical mean = 1 (ns = not significant, 5 min; *P = 0.0467, 30 min; ***P = 0.0005, 45 min; **P = 0.0014, 60 min; **P = 0.0018). f Epha2+/+ mESCs cultured in LIF/FBS were stimulated with 1 μg/ml clustered EFNA1 for the indicated times. SHP2 was immunoprecipitated, and SHP2 and EPHA2 levels detected by immunoblotting. Source data are provided as a Source Data file.

