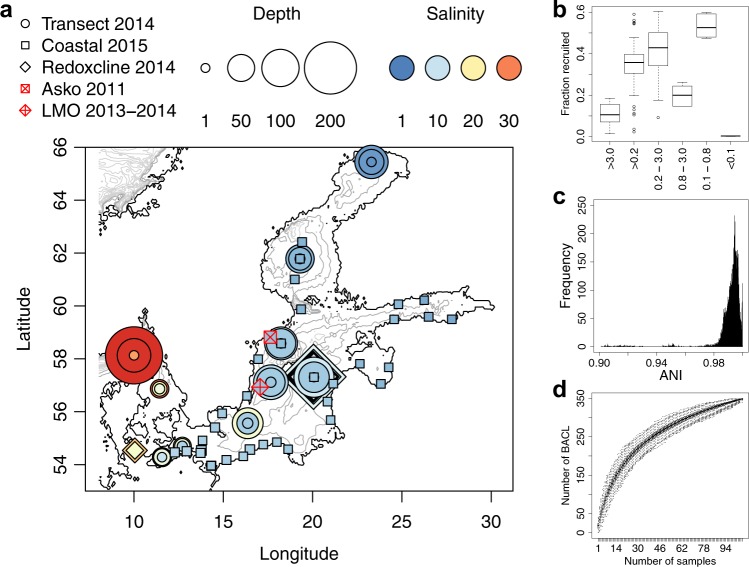
Fig. 1. Sampling stations and summary of metagenome binning results.
a Map of sampling locations. The included sample sets are indicated with different symbols. The marker colour indicates the salinity of the water sample while the size indicates the sampling depth. The contour lines indicate depth with 50 m intervals. Three of the sample sets have previously been published: Askö Time Series 201160 (n = 24), Redoxcline 201433 (n = 14) and Transect 201433 (n = 30); and two are released with this paper: LMO Time Series 2013–2014 (n = 22) and Coastal Transect 2015 (n = 34). The map was generated with the marmap R package77 using the ETOPO1 database hosted by NOAA78. b Proportion of metagenome reads recruited to the metagenome-assembled genomes (MAGs), summarized with one boxplot per filter size fraction. c Distribution of pairwise inter-MAG distances. Only average nucleotide identity (ANI) values >0.9 are shown. Minimum and maximum within-cluster identity for multi MAG Baltic Sea clusters (BACL) were 96.8% and 100.0%, respectively. Only four BACLs had any MAG with >96.5% identity to any MAG in another BACL. d Rarefaction curve showing number of obtained BACLs as a function of number of samples. Boxplots show distributions from 1000 random samplings.

