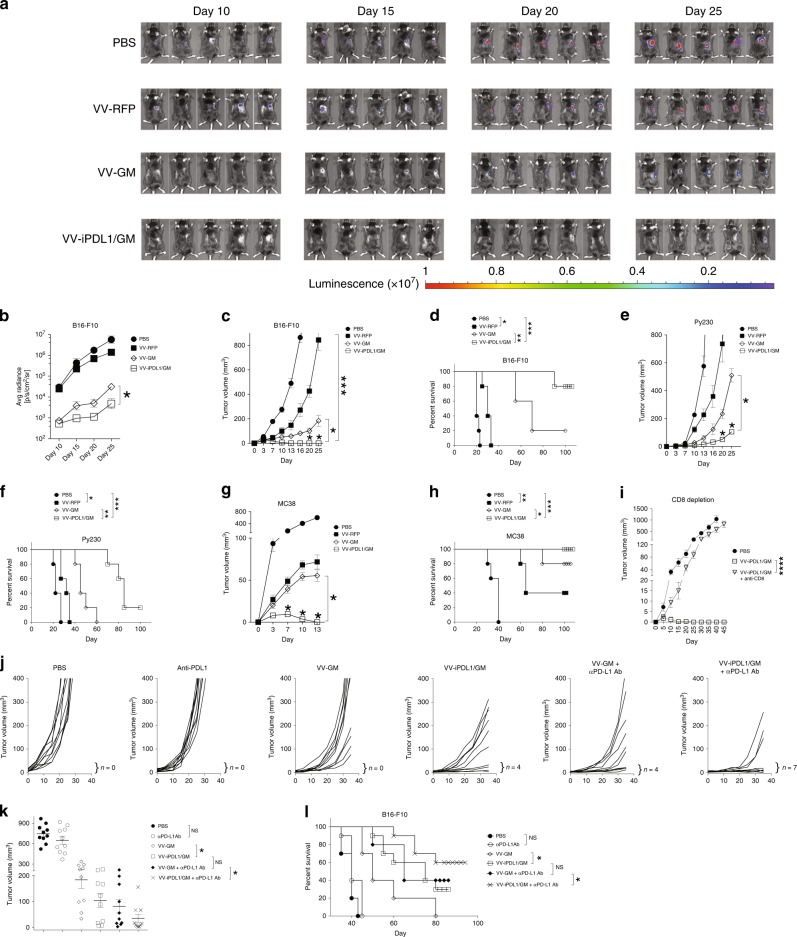
Fig. 4. Enhanced antitumor activities against untreated, distant tumors.
a–d Inhibition of rechallenged tumor growth. B16-F10 melanoma cells were implanted intradermally to the left flank of C57B/6 mice. When tumor sizes reached ~100 mm3 (counted as day 0), the mice were intratumorally injected with the indicated VVs on days 0, 3, and 7. Treated mice were s.c. rechallenged with B16-F10-Luc cells 30 days after the last VV injection (counted as day 0 for rechallenge data). Bioluminescence monitoring a, b and caliper measurement of B16-F10-Luc cells c were performed. Data are presented as means ± SD (n = 5 mice). d Survival curve of B16-F10 rechallenged mice. e–h The volumes of rechallenged Py230 e or MC38 g tumors were monitored using a similar treatment schedule as in a, except that 5 × 10⁵ of Py230 or MC38 tumor cells were rechallenged. Data are presented as means ± SD (n = 5 mice). *P < 0.05, ***P < 0.001 determined by two-way ANOVA. Survival curve of Py230 f and MC38 h rechallenge mice. *P < 0.05, *** P < 0.001 by two-tailed Log rank test. i CD8 T cell depletion. Surviving mice treated with VV-iPDL1/GM for the original left flank tumor implantation were rechallenged with 5 × 10⁵ MC38 cells at right side without or with weekly i.v. injections of anti-CD8 antibody for two times. Data are presented as means ± SD (n = 5 mice). ****P < 0.01 by two-tailed repeated-measures two-way ANOVA. j–l Inhibition of untreated, established tumor growth. B16-F10 melanoma cells were implanted to the left and right flanks of C57B/6 mice. The mice were intratumorally injected to the left flank tumors with indicated VVs without or with i.v. injections of anti-PD-L1 antibody on days 0, 3, and 7. j Individual curves are depicted for each tumor. Numbers indicate complete tumor regression out of total tumors in each group. k Distribution of tumor volumes determined on day 30 after virus injection; n = 10 mice. Bars represent mean values ± SD. *P < 0.05 by two-tailed Mann–Whitney U test. l Cumulative survival curves. Data are from two independent experiments. *P < 0.05; **P < 0.01; NS, not significant by two-tailed Log rank test.

