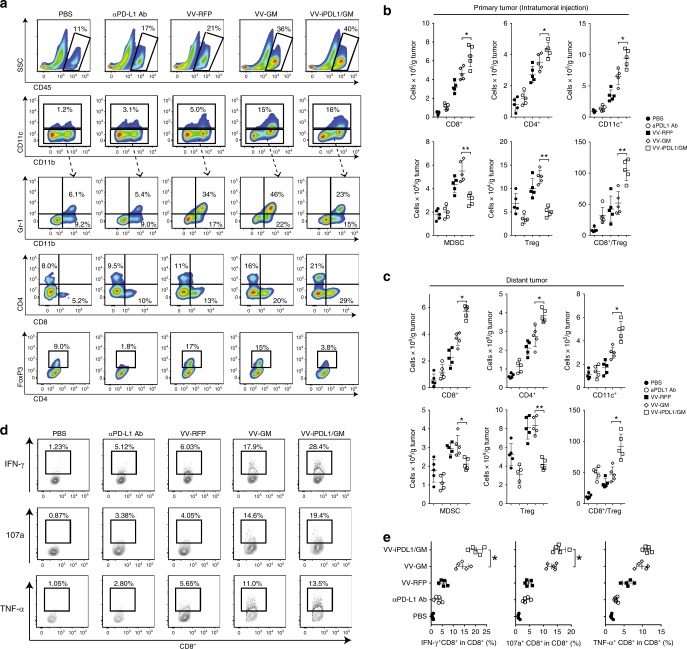
Fig. 5. Enhanced tumor infiltration and activation of immune cells.
A similar treatment schedule as in Fig. 2c was used, except that 5 days after the second VV injection, VV-treated MC38 tumors were harvested, weighed, and digested for preparation of single-cell suspensions followed by antibody staining against CD45, CD8, CD4, CD11c, CD11b, Gr-1, and FoxP3. a–c Representative plots of the percentages of infiltrating CD45+ immune cells, DCs, MDSCs, CD4+ T cells, CD8+ T cells, and Tregs in treated tumors a. Absolute numbers of the above immune cells and CD8+ T cell/Treg ratio values in treated tumors b and distant, untreated tumors c. n = 5 mice. Data presented as the means ± SD. *P < 0.05, **P < 0.01 by two-tailed Student’s t-test. d, e Expression of IFN-γ, TNF-α, and CD 107a of tumor-infiltrating CD8+ T cells in response to restimulation with MC38 tumor lysate-pulsed DCs in the presence of Golgi-plug for 8 h were measured by intracellular staining d. e Quantitative presentation of d. n = 5 mice. Data presented as the means ± SD. *P < 0.05 by two-tailed Student’s t-test.

