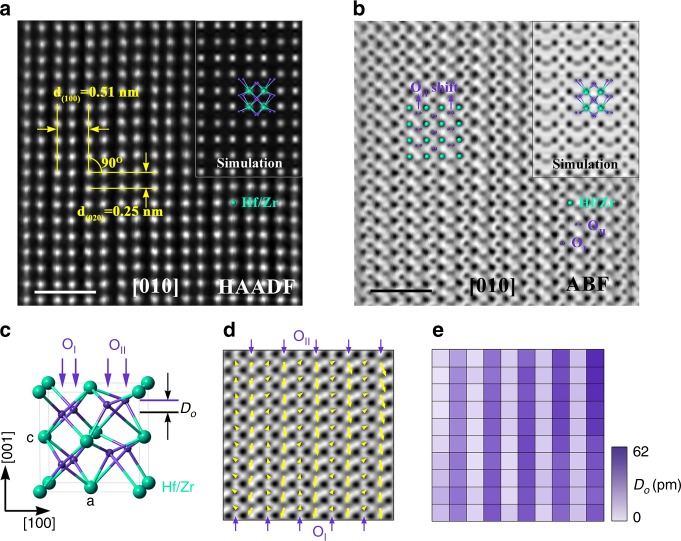
Fig. 2. Atomic structure of HZO orthorhombic phase.
a Scanning transmission electron microscopy high-angle annular dark-field (STEM-HAADF) image of the HZO grain projected along O [010] zone axes with the inset of simulated HAADF picture. Scale bar, 1 nm. b The corresponding scanning transmission electron microscopy high-angle annular dark-field annular bright-field (STEM-ABF) image of (a) with the inset of simulated ABF picture. Scale bar, 1 nm. c Schematic of the unit cell of HZO, where DO denotes the relative displacement of O atoms. d O atomic displacement vector map from the area in (b). The yellow arrows indicate reversed O atom displacement (DO) vectors, which were consistent with the spontaneous polarization direction in (b). e Two-dimensional O atomic displacement map relative to the central positions of the four nearest heavy atoms, which corresponds to the yellow arrows in (d).

