Figure 7.
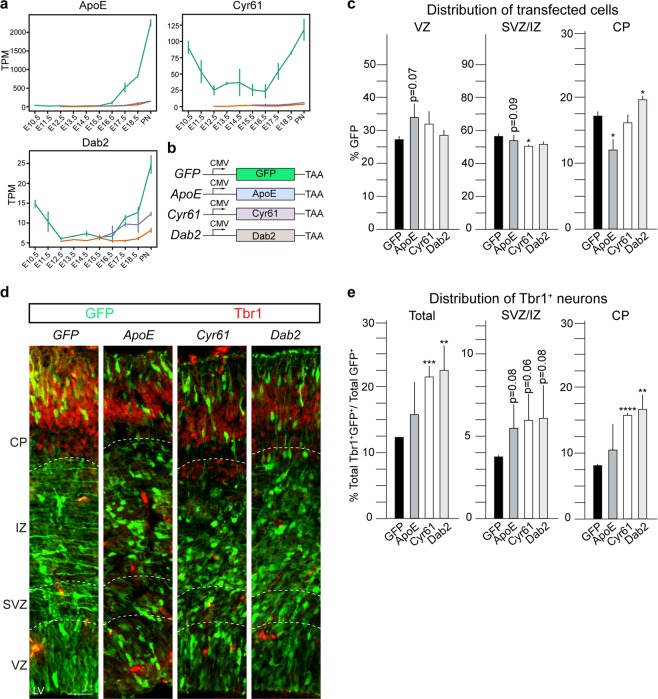
ApoE, Cyr61 and Dab2 overexpression recapitulate Tead overexpression phenotypic changes. (a) mRNA expression profiles of ApoE, Cyr61 and Dab2 in NSCs, BPs and NBNs. (b) Expression constructs used for overexpression. (c) Quantification of distribution of GFP+ transfected cells shows ApoE overexpression recapitulates Tead2 overexpression phenotype while Dab2 overexpression recapitulates the Tead1 overexpression phenotype. (d) Coronal sections of transfected cortices immunostained for GFP and Tbr1. (e) Quantification of Tbr1+GFP+ cells shows an increase upon overexpression of Cyr61 and Dab2, compared to GFP control in CP and all zones. Also see Figs. S7 and S8. Summaries of the quantifications are in Table S6. Scale bar = 50 μm. Data are shown as average ± SEM,*p = 0.05, **p = 0.01, ***p = 0.001, ****p = 0.0001.

