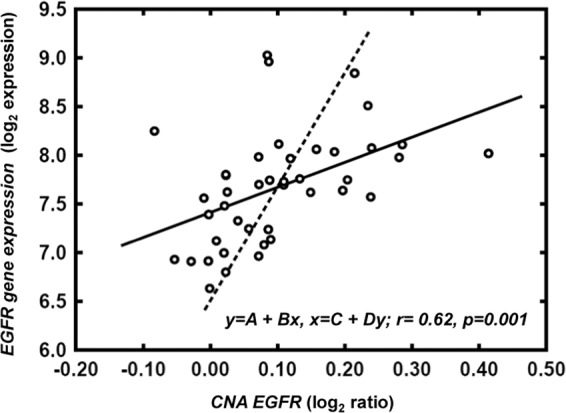
Figure 3.

Correlation between EGFR gene expression using oligonucleotide arrays and CNA by SNP arrays in patients with sporadic colorectal cancer at diagnosis. The graphs show the regression lines for Y as a function of X (solid line) and for X as a function of Y (dashed line). If these regression lines are approximately perpendicular, it indicates that X and Y are not linearly correlated. The closer the lines, the greater the correlation.
