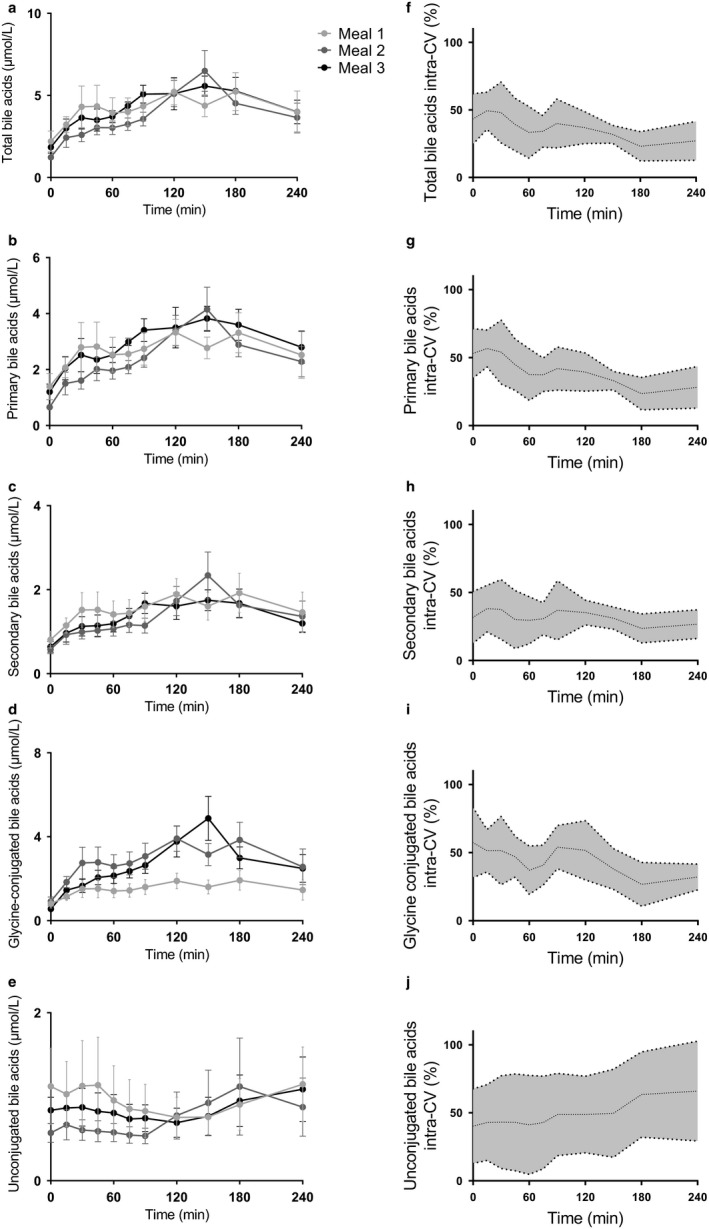
Figure 2.

Postprandial bile acids responses and intracoefficicients of variance (intra‐CV) to the three identical liquid mixed meal tests in healthy lean men. In a crossover design, eight healthy lean men underwent three identical liquid mixed meal tests in a period of 2 weeks at T = 0 after an overnight fast. On the left panel, postprandial excursions of (a) total bile acids, (b) primary bile acids, (c) secondary bile acids, (d) glycine conjugated bile acids, and (e) unconjugated bile acids are shown. Each color represents a different meal and data are presented as mean and SEM. On the right panel, the intra‐CVs of (f) total bile acids, (g) primary bile acids, (h) secondary bile acids, (i) glycine‐conjugated bile acids, and (j) unconjugated bile acids are displayed. Data are presented as mean and 95% confidence interval
