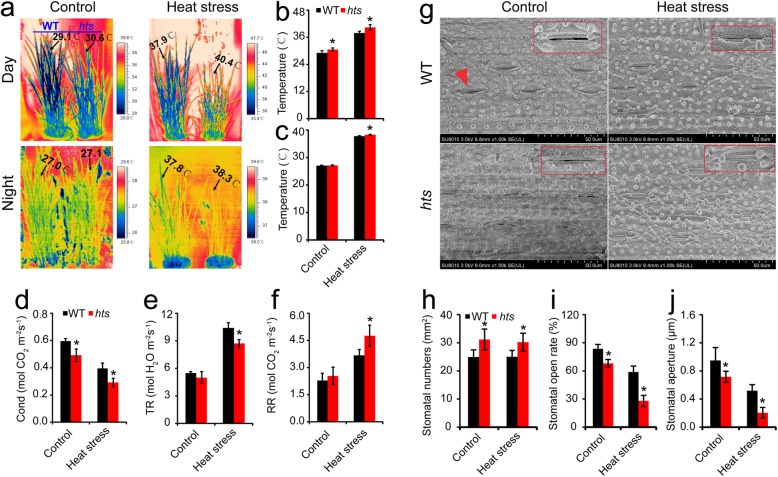
Fig. 3.
Effect of heat stress on leaf tissue temperature in rice plants. a, Thermal images of rice plants under control and heat stress during the day and night; b and c, Average leaf temperature values at day and night, respectively; d and e, Stomatal conductance (Cond) and transpiration rates (TR) during the day; f, Respiration rate (RR) of leaves at night. g, Leaf morphology under control and heats tress, respectively; h, Numbers of stomata in leaves; i, Stomatal opening rate of leaves; j, Stomatal aperture of leaves. Red triangle indicates the stomata; Red rectangle indicates that the photographs of stomata were taken at 2000-folds. Vertical bars denote standard deviations (n = 3). A t-test was conducted to compare the difference between the control and heat stress within a cultivar on the same day. * denotes P < 0.05

