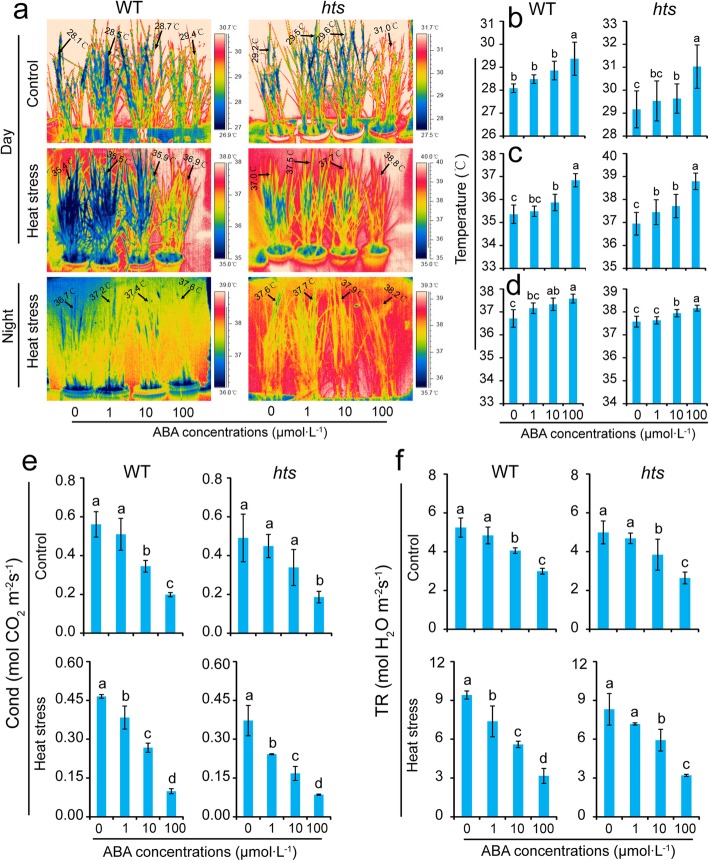
Fig. 6.
Changes in tissue temperatures, stomatal conductance, and transpiration rates of rice plant leaves caused by ABA under heat stress. a, Thermal images of rice plants under the control and heat stress treatments during the day and night; b, Average leaf tissue temperature values at day under control conditions; c, Average leaf tissue temperature values at day under heat stress; d, Average leaf tissue temperature values at night under heat stress; e, Stomatal conductance (Cond); f, Transpiration rate (TR). Vertical bars denote standard deviations (n = 10 or 3). Different letters indicate significant differences among ABA treatments under the control and heat stress conditions within a genotype by two-way analysis of variance for two factors (temperature and treatment) (P < 0.05)

