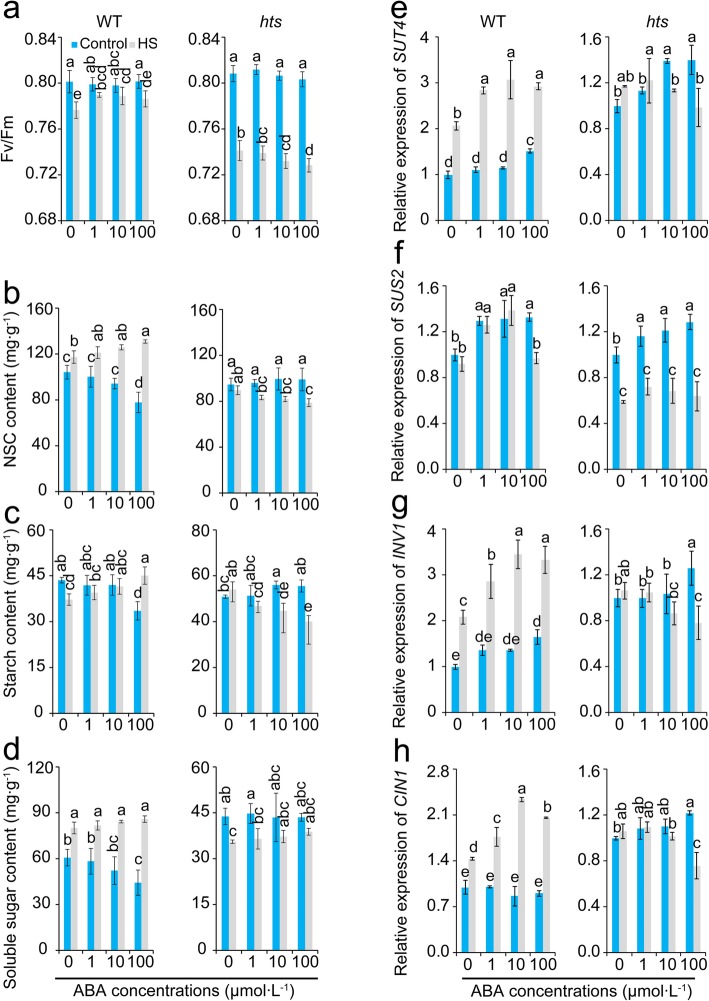
Fig. 7.
Effect of ABA on Fv/Fm, carbohydrate content and metabolism of leaves in rice plants under heat stress. a, Fv/Fm; b, NSC content; c, starch content; d, soluble sugar content; e, Relative expression level of SUT4; f, Relative expression level of SUS2; g, Relative expression level of INV1; h, Relative expression level of CIN1. Vertical bars denote standard deviations (n = 3). Different letters indicate a significant difference among ABA treatments under the control and heat-stressed conditions within a genotype by two-way analysis of variance for two factors (temperature and treatment) (P < 0.05)

